
Homework Answers

Add Answer to:
10. The owner of a company has asked you to conduct an evaluation of the customer...
Consumer Reports uses a 100-point customer satisfaction score to rate the nation's major chain stores. Assume...
 Consumer Reports uses a 100-point customer satisfaction score to rate the nation's major chain stores. Assume that from past experience with the satisfaction rating score, a population standard deviation of o=12 is expected. Costco with its 432 warehouses in 40 states was the only chain store to earn an outstanding rating for overall quality. A sample of 15 Costco customer satisfaction scores is contained in the Excel Online file below. Construct a spreadsheet to answer the following questions. X Open...
Hypothesis Testing Method A = ADKAR Framework (column A) Method B = Prosci Change Management Methodology...
Hypothesis Testing Method A = ADKAR Framework (column A) Method B = Prosci Change Management Methodology (column B) Null hypothesis is H0: Method A = Method B Research (Alternative) hypothesis is H1:Method A < Method B Sample size: 30 One-tailed test: Direction stated in the hypothesis is determine more effective (greater or less than). Level of Significance (a): .05 t-test is used because standard deviation of population is unknown, sample size is less than 30 Cutoff Sample Score (critical value)...
Consider a situation where we want to compare means, M1 and 42 of two populations, Group...
 Consider a situation where we want to compare means, M1 and 42 of two populations, Group 1 and Group 2, respectively. A random sample of 40 observations was selected from each of the two populations. The following table shows the two-sample t test results at a = 5% assuming equal population variances: t-Test: Two-Sample Assuming Equal Variances Group 2 28652 33.460 40 Mean Variance Observations Pooled Variance Hypothesized Mean Difference d t Stat PTcut) one-tail Critical one-tail PTC-t) two-tail Critical...
3. Testing a population mean The test statistic (Chapter 11) Aa Aa You conduct a hypothesis...
 3. Testing a population mean The test statistic (Chapter 11) Aa Aa You conduct a hypothesis test about a population mean u with the following null and alternative hypotheses: Ho: u-25.8 H1: <25.8 Suppose that the population standard deviation has a known value of a observations, which provides a sample mean of % 30.7. 17.8. You obtain a sample of n =62 Since the sample size large enough, you assume that the sample mean X follows a normal distribution. Let...
You conduct a hypothesis test about a population proportion p at a significance level of a...
 You conduct a hypothesis test about a population proportion p at a significance level of a = .01 using a random sample of size n = 38. Your test statistic follows a standard normal distribution when the null hypothesis is true as an equality, and its value obtained from the sample is z = -2.75. Use the Distributions tool to help you answer the questions that follow. Select a Distribution Distributions 0 1 2 3 If you perform a lower...
The sample data consist of 23 houses from a specific city yielded the average house price...
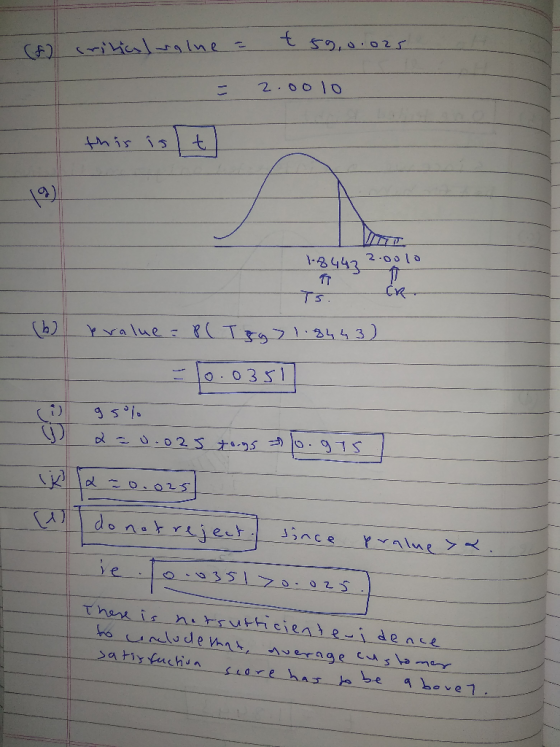
The sample data consist of 23 houses from a specific city yielded the average house price $226,460 and the standard deviation of the house price $11,500. Use a significance level 0.01 to test whether the mean house price of the whole city is more than $220,000. Compute the value of the test statistic, and P-value for the specified hypothesis test and state your conclusion. Assume the house prices of this city follows normal distribution. Question 2 options: Test statistic: t...
The sample data consist of 23 houses from a specific city yielded the average house price...
 The sample data consist of 23 houses from a specific city yielded the average house price $226,460 and the standard deviation of the house price $11,500. Use a significance level 0.01 to test whether the mean house price of the whole city is more than $220,000. Compute the value of the test statistic, and P-value for the specified hypothesis test and state your conclusion. Assume the house prices of this city follows normal distribution. Test statistic: t = 2.69, p-value...
You are asked to conduct a simulation and run a hypothesis test at a significance level...
You are asked to conduct a simulation and run a hypothesis test at a significance level of 0.10. Based on your simulation, you find that the p-value is 0.051. What does this mean for your hypothesis test? 1. Since the p-value is greater than the significance level, you must fail to reject the null hypothesis. 2. Since the p-value is less than the significance level, you must fail to reject the null hypothesis. 3. Since the p-value is less than...
The Student's t distribution table gives critical values for the Student's t distribution. Use an appropriate...
The Student's t distribution table gives critical values for the Student's t distribution. Use an appropriate d.f. as the row header. For a right-tailed test, the column header is the value of α found in the one-tail area row. For a left-tailed test, the column header is the value of α found in the one-tail area row, but you must change the sign of the critical value t to −t. For a two-tailed test, the column header is the value...
CAN YOU PLEASE FIX MY LAST TWO SENTENCES WITH THIS INFORMATION? You note in your report...
CAN YOU PLEASE FIX MY LAST TWO SENTENCES WITH THIS INFORMATION? You note in your report both the t critical for a one tailed and a two tailed test. Identify whether you need to use a one tailed or a two tailed test for the test statistic and t critical. Then only compare the test statistic with that critical value. Otherwise when you mention both, it looks like you don't know which one to use. t-Test: Two-Sample Assuming Unequal Variances...
 Consumer Reports uses a 100-point customer satisfaction score to rate the nation's major chain stores. Assume that from past experience with the satisfaction rating score, a population standard deviation of o=12 is expected. Costco with its 432 warehouses in 40 states was the only chain store to earn an outstanding rating for overall quality. A sample of 15 Costco customer satisfaction scores is contained in the Excel Online file below. Construct a spreadsheet to answer the following questions. X Open...
 Consider a situation where we want to compare means, M1 and 42 of two populations, Group 1 and Group 2, respectively. A random sample of 40 observations was selected from each of the two populations. The following table shows the two-sample t test results at a = 5% assuming equal population variances: t-Test: Two-Sample Assuming Equal Variances Group 2 28652 33.460 40 Mean Variance Observations Pooled Variance Hypothesized Mean Difference d t Stat PTcut) one-tail Critical one-tail PTC-t) two-tail Critical...
 3. Testing a population mean The test statistic (Chapter 11) Aa Aa You conduct a hypothesis test about a population mean u with the following null and alternative hypotheses: Ho: u-25.8 H1: <25.8 Suppose that the population standard deviation has a known value of a observations, which provides a sample mean of % 30.7. 17.8. You obtain a sample of n =62 Since the sample size large enough, you assume that the sample mean X follows a normal distribution. Let...
 You conduct a hypothesis test about a population proportion p at a significance level of a = .01 using a random sample of size n = 38. Your test statistic follows a standard normal distribution when the null hypothesis is true as an equality, and its value obtained from the sample is z = -2.75. Use the Distributions tool to help you answer the questions that follow. Select a Distribution Distributions 0 1 2 3 If you perform a lower...
 The sample data consist of 23 houses from a specific city yielded the average house price $226,460 and the standard deviation of the house price $11,500. Use a significance level 0.01 to test whether the mean house price of the whole city is more than $220,000. Compute the value of the test statistic, and P-value for the specified hypothesis test and state your conclusion. Assume the house prices of this city follows normal distribution. Test statistic: t = 2.69, p-value...
Most questions answered within 3 hours.
-
If you titrated 30.0 mL of 0.1 M HCl with 0.1 M NaOH, indicate
the approximate...
asked 20 seconds ago -
NADH passes electrons into the electron transport chain. List
the carriers that would receive the electrons,...
asked 8 minutes ago -
A cylindrical cable with a resistivity of 1.6x10⁻⁸ Ω·m and cross
sectional area of 3x10⁻⁵ m^2...
asked 8 minutes ago -
True or False.
A consumer with convex preferences who is indifferent between
the bundles (5,2) and...
asked 12 minutes ago -
A diamond's index of refraction for red light, 656 nm, is 2.410,
while that for blue...
asked 25 minutes ago -
Compare HPLC, SPE, and GC. Identify the differences, the
advantages, and the weaknesses of each method.
asked 26 minutes ago -
Characteristic x-rays emitted by potassium have a wavelength of
0.374 nm. What is the energy of...
asked 28 minutes ago -
there is a function to create two random numbers between 1 and
25 and a function...
asked 46 minutes ago -
At a certain temperature, the ?pKp for the decomposition of
H2SH2S is 0.832.0.832.
H2S(g)↽−−⇀H2(g)+S(g)H2S(g)↽−−⇀H2(g)+S(g)
Initially, only...
asked 40 minutes ago -
Part 1.C&A Fast Food has four activities in serving a
customer: greet customer, take order, process...
asked 46 minutes ago -
Which attribute allows you to specify a custom "thumbnail" for
multimedia elements?
asked 1 hour ago -
How much 0.1200 M sodium hydroxide solution is need to titrate
14 mL of a 0.100...
asked 1 hour ago