![The following data were obtained in an enzyme study: [S] (HM) v (HM mini) 2.91 2.00 3.00 3.83 4.00 4.35 4.87 5.00 6.00 5.42 7.00 5.75 6.21 8.00 9.00 6.36 10.00 6.73 Use these data to construct a Michaelis-Menten plot, a Lineweaver-Burk plot, and an Eadie-Hofstee plot. Fit the data in the L-B and E-H plots and use the fit parameters to determine KM and vs in each case. Comment on how well the KMs and vss agree with each other.](http://img.homeworklib.com/questions/187e6500-aade-11eb-a84a-474e73184d93.png?x-oss-process=image/resize,w_560)
Homework Answers
|
[S] µM |
v, µMmin-1 |
1/[S] µM-1 |
1/v, min/µM |
v/[s] min-1 |
|
0 |
0 |
- |
- |
- |
|
2 |
2.91 |
0.50 |
0.34 |
1.46 |
|
3 |
3.83 |
0.33 |
0.26 |
1.28 |
|
4 |
4.35 |
0.25 |
0.23 |
1.09 |
|
5 |
4.87 |
0.20 |
0.21 |
0.97 |
|
6 |
5.42 |
0.17 |
0.18 |
0.90 |
|
7 |
5.75 |
0.14 |
0.17 |
0.82 |
|
8 |
6.21 |
0.13 |
0.16 |
0.78 |
|
9 |
6.36 |
0.11 |
0.16 |
0.71 |
|
10 |
6.73 |
0.10 |
0.15 |
0.67 |
a) Michaelis-Menten Plot: Plot of Reaction rate, v vs substrate concentration, [S]
![Michaelis-Menten Plot 10 [S], HM](http://img.homeworklib.com/questions/193bb530-aade-11eb-922d-65011407d310.png?x-oss-process=image/resize,w_560)
b) Lineweaver-Burk Plot: Plot of 1/v vs 1/[S]
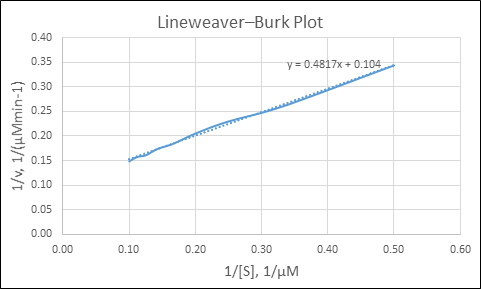
y-intercept = 0.104 = 1/Vs
Vs = 9.6 µMmin-1
Slope = 0.4817 = Km/Vs
Km = 0.4817 * 9.6 = 4.63 µM
c) Eadie-Hoftee Plot: Plot of v vs v/[S]
![Eadie-Hofstee Plot y:-4.7599X+9.7462m 0.60 0.80 1.00 1.20 1.40 1.60 v/[S], 1/min](http://img.homeworklib.com/questions/19f70d60-aade-11eb-94f6-e319552019e4.png?x-oss-process=image/resize,w_560)
y-intercept = 9.75 = Vs
Vs = 9.75 µMmin-1
Slope = -4.76 = - Km
Km = 4.76 µM
*Results of Lineweaver-Burk and Eadie-Hoftee are close in value (<0.2 – 0.3 % difference).
Add Answer to:
The following data were obtained in an enzyme study: Use these data to construct a Michaelis-Menten...
The kinetics of enzyme catalyzed reactions can be described the Michaelis-Menten equation and the Eadie-Hofstee equatio...
The kinetics of enzyme catalyzed reactions can be described the Michaelis-Menten equation and the Eadie-Hofstee equation as shown below: V0 = (-Km) V0 / [S] + Vmax a). Please derive the Eadie-Hofstee equation starting from the Michaelis-Menten equation. b). The Vmax and Km of the enzyme catalyzed reaction can be derived from a plot of V0 versus V0/[S]. Please draw one of these plots and explain how do you use it to derive Vmax and Km. c). Please draw a...
2. If an inhibitor competitively inhibits an enzyme, use Michaelis-Menten and Lineweaver-Burk plots to illustrate how...
 2. If an inhibitor competitively inhibits an enzyme, use Michaelis-Menten and Lineweaver-Burk plots to illustrate how the enzyme kinetics differ in the presence and absence of the inhibitor. (20 pts)
Michaelis-Menten plot and Lineweaver-Burk plot calculations- use provided data to generate both M-M and L-B plots....
 Michaelis-Menten plot and Lineweaver-Burk plot calculations- use provided data to generate both M-M and L-B plots. Use scatter plots with markers on Excel to determine Vinas, KM, kcat, kcat/KM. The total enzyme concentration is 5 μM. Graphs can be 2 page. Must be computer generated with all axes labeled. Substrate (mM Vo (mM/s) 2.73 5.45 8.17 10.9 40.4 0.124 0.181 0.212 0.228 0.303
Michaelis-Menten plot and Lineweaver-Burk plot calculations: Use provided data to generate both M-M and L-B plots....
 Michaelis-Menten plot and Lineweaver-Burk plot calculations: Use provided data to generate both M-M and L-B plots. Use scatter plots with markers on Excel: On the M-M Plot: estimate Vmax, KM On the L-B Plot: determine Vmax, KM, keat, kcat/Km. The total enzyme concentration is 5 uM. Graphs can be 1/2 page. Must be computer generated with all axes labeled. Substrate (mM) V. (mM/s) | 1/[S] (mM1) 1/V. (s/mM) 10 | 0 2.73 5.45 8.17 10.9 40.4 0.124 0.181 0.212 0.228...
o Flipped class: Michaelis-Menten vs. Lineweaver-Burk 10 Essentially, we'll duplicate the error estimates from (A) a...
 o Flipped class: Michaelis-Menten vs. Lineweaver-Burk 10 Essentially, we'll duplicate the error estimates from (A) a nonlinear fit and (B) a nonlinear function transformed into linear form in Matlab. 1) Use Matlab to generate synthetic data obeying the Michaelis-Menten equation i.e. find dP/dt for [S] = 1:20. Add noise to the data (rand or randn or normmd). Use Vmax-1, km-5 2) Plot the data points (dP/dt vs [S]) that you've obtained. Fit the data (model1:- fitnlm(x,y.modelname,jnitialguesses). Output the estimated Vmax...
Write the equations that describe the Michaelis-Menten and the Lineweaver-Burk double-reciprocal plots. Draw examples of each...
Write the equations that describe the Michaelis-Menten and the Lineweaver-Burk double-reciprocal plots. Draw examples of each plot, demonstrating how Km and Vmax can be determined. On the same graphs, draw another plot where the same enzyme-catalyzed reaction is subjected to inhibition by a competitive inhibitor.
Enzyme Kinetics Problem The initial rate for an enzyme-catalyzed reaction has been determined at a number...
 Enzyme Kinetics Problem The initial rate for an enzyme-catalyzed reaction has been determined at a number of substrate concentrations. Data are given below: 5 27 23 65 1. Estimate V and K from a Michaelis-Menten graph of V versus [S] 2. Use a Lineweaver-Burk plot to analyze the same data. a. Determine V and Ka from the Lineweaver-Burk BONUS: If the total enzyme concentration was I nmol/L, what is K?
Enzyme Kinetics Problem The initial rate for an enzyme-catalyzed reaction...
Enzyme Kinetics Problem The initial rate for an enzyme-catalyzed reaction has been determined at a number of substrate concentrations. Data are given below: 5 27 23 65 1. Estimate V and K from a Michaelis-Menten graph of V versus [S] 2. Use a Lineweaver-Burk plot to analyze the same data. a. Determine V and Ka from the Lineweaver-Burk BONUS: If the total enzyme concentration was I nmol/L, what is K?
Enzyme Kinetics Problem The initial rate for an enzyme-catalyzed reaction...
ISU Question 3: Use the data below to construct a Michaelis-Menton curve of velocity vs. [S]....
 ISU Question 3: Use the data below to construct a Michaelis-Menton curve of velocity vs. [S]. This is quite easy to do in Excel. Vo 1/[S1 1/V0 UM (UM/s) M (s/uM) 340 10 2.94E-03 0.2 530 740 0.8 910 1.6 1040 0.4 a) Estimate Vmax from your curve. b) Describe any difficulty you have in completing part (a). Is the enzyme saturated at the highest (SD? c) Using your Vmax estimate, calculate 14 Vmax, and using your curve, estimate Km....
(3 of 5) The following data were obtained in a study of an enzyme known to...
 (3 of 5) The following data were obtained in a study of an enzyme known to follow Michaelis-Menten kinetics: Vo Substrate added (pmol/min) (mmol/L) 21710 - 3252 0 433 40 488 60 647 1,000 650 2,000 6513 ,000 Upon a simple inspection (no need of calculations or graphing) of the data one would predict the Vmax for this enzyme to be approximately: 217 pmol/min 325 pmol/min 651 umol/min 60 mmol/L 3000 mmol/L
ssessable tutorial que 03/2018 The conversion of corn starch to dextrose using the enzyme glucoamylase was...
 ssessable tutorial que 03/2018 The conversion of corn starch to dextrose using the enzyme glucoamylase was studied in a batch reactor at 60°C. The initial concentration of corn starch was 25 gl. The dosage of glucoamylase, Eo, was 11.6 mgL-. Figure 1, below, shows a Lineweaver-Burk plot for results obtained for the starch to dextrose enzymatic process. 0.13 0.12 0.11 0.10 Slope of plot 1.1 hr y-intercept of plot-0.033 hr L/g 0.09 0.08 0.07 0.04 0.05 0.06 0.07 0.08 0.09...
 2. If an inhibitor competitively inhibits an enzyme, use Michaelis-Menten and Lineweaver-Burk plots to illustrate how the enzyme kinetics differ in the presence and absence of the inhibitor. (20 pts)
 Michaelis-Menten plot and Lineweaver-Burk plot calculations- use provided data to generate both M-M and L-B plots. Use scatter plots with markers on Excel to determine Vinas, KM, kcat, kcat/KM. The total enzyme concentration is 5 μM. Graphs can be 2 page. Must be computer generated with all axes labeled. Substrate (mM Vo (mM/s) 2.73 5.45 8.17 10.9 40.4 0.124 0.181 0.212 0.228 0.303
 Michaelis-Menten plot and Lineweaver-Burk plot calculations: Use provided data to generate both M-M and L-B plots. Use scatter plots with markers on Excel: On the M-M Plot: estimate Vmax, KM On the L-B Plot: determine Vmax, KM, keat, kcat/Km. The total enzyme concentration is 5 uM. Graphs can be 1/2 page. Must be computer generated with all axes labeled. Substrate (mM) V. (mM/s) | 1/[S] (mM1) 1/V. (s/mM) 10 | 0 2.73 5.45 8.17 10.9 40.4 0.124 0.181 0.212 0.228...
 o Flipped class: Michaelis-Menten vs. Lineweaver-Burk 10 Essentially, we'll duplicate the error estimates from (A) a nonlinear fit and (B) a nonlinear function transformed into linear form in Matlab. 1) Use Matlab to generate synthetic data obeying the Michaelis-Menten equation i.e. find dP/dt for [S] = 1:20. Add noise to the data (rand or randn or normmd). Use Vmax-1, km-5 2) Plot the data points (dP/dt vs [S]) that you've obtained. Fit the data (model1:- fitnlm(x,y.modelname,jnitialguesses). Output the estimated Vmax...
 Enzyme Kinetics Problem The initial rate for an enzyme-catalyzed reaction has been determined at a number of substrate concentrations. Data are given below: 5 27 23 65 1. Estimate V and K from a Michaelis-Menten graph of V versus [S] 2. Use a Lineweaver-Burk plot to analyze the same data. a. Determine V and Ka from the Lineweaver-Burk BONUS: If the total enzyme concentration was I nmol/L, what is K?
Enzyme Kinetics Problem The initial rate for an enzyme-catalyzed reaction...
Enzyme Kinetics Problem The initial rate for an enzyme-catalyzed reaction has been determined at a number of substrate concentrations. Data are given below: 5 27 23 65 1. Estimate V and K from a Michaelis-Menten graph of V versus [S] 2. Use a Lineweaver-Burk plot to analyze the same data. a. Determine V and Ka from the Lineweaver-Burk BONUS: If the total enzyme concentration was I nmol/L, what is K?
Enzyme Kinetics Problem The initial rate for an enzyme-catalyzed reaction...
 ISU Question 3: Use the data below to construct a Michaelis-Menton curve of velocity vs. [S]. This is quite easy to do in Excel. Vo 1/[S1 1/V0 UM (UM/s) M (s/uM) 340 10 2.94E-03 0.2 530 740 0.8 910 1.6 1040 0.4 a) Estimate Vmax from your curve. b) Describe any difficulty you have in completing part (a). Is the enzyme saturated at the highest (SD? c) Using your Vmax estimate, calculate 14 Vmax, and using your curve, estimate Km....
 (3 of 5) The following data were obtained in a study of an enzyme known to follow Michaelis-Menten kinetics: Vo Substrate added (pmol/min) (mmol/L) 21710 - 3252 0 433 40 488 60 647 1,000 650 2,000 6513 ,000 Upon a simple inspection (no need of calculations or graphing) of the data one would predict the Vmax for this enzyme to be approximately: 217 pmol/min 325 pmol/min 651 umol/min 60 mmol/L 3000 mmol/L
 ssessable tutorial que 03/2018 The conversion of corn starch to dextrose using the enzyme glucoamylase was studied in a batch reactor at 60°C. The initial concentration of corn starch was 25 gl. The dosage of glucoamylase, Eo, was 11.6 mgL-. Figure 1, below, shows a Lineweaver-Burk plot for results obtained for the starch to dextrose enzymatic process. 0.13 0.12 0.11 0.10 Slope of plot 1.1 hr y-intercept of plot-0.033 hr L/g 0.09 0.08 0.07 0.04 0.05 0.06 0.07 0.08 0.09...
Most questions answered within 3 hours.
-
How do the mechanical features of bone affect its roles as
repositories of phosphate and calcium,...
asked 1 minute ago -
P agreed to buy 100 barrels of widget oil, which was stored in a
large tank...
asked 2 minutes ago -
The unstable isotope 40K is used for dating rock samples. Its
half-life is 1.28×10⁹y. How many...
asked 4 minutes ago -
Compare and contrast constructed-response items and
selected-response items.
Identify at least one (1) advantage and one...
asked 6 minutes ago -
A) Find the moment of inertia of a 2 meter long stick with a
mass of...
asked 5 minutes ago -
For the code below write a public static main() method
in class Student that:
- creates...
asked 7 minutes ago -
Please show all steps. Thank you
A 1.0-cm-diameter pipe widens to 2.0 cm, then narrows to...
asked 20 minutes ago -
The equilibrium constant for the following reaction Ag+(aq) +
2NH3(aq) Ag(NH3)2+(aq) is K = 1.7 ×...
asked 28 minutes ago -
A carbon heater element has fixed resistance of 28 Ohms. It is
connected to an A/C...
asked 29 minutes ago -
Suppose X∼Exp(λ) for some λ >0. Compute E(X) and Var(X).
asked 43 minutes ago -
Xanth Co. has 8.9% annual coupon bonds with face value of $1,000
and 7 years remaining...
asked 41 minutes ago -
The Bellevue University bookstore purchases sweatshirts with the
school name and logo from a vendor. The...
asked 44 minutes ago