
Homework Answers

Add Answer to:
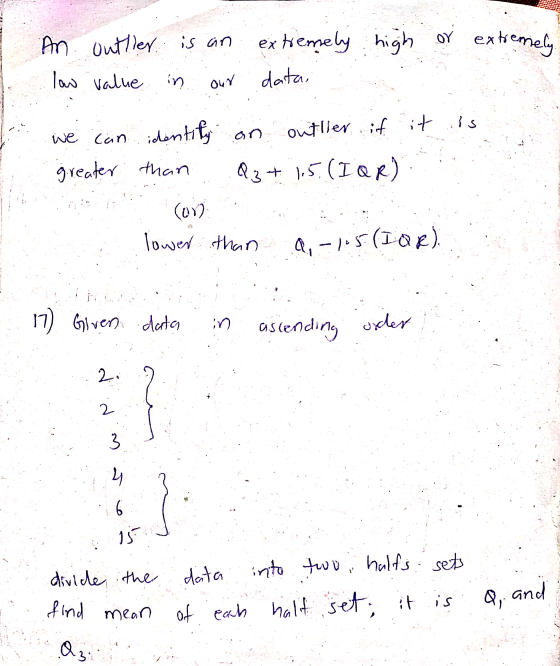
#17
please
For 17 - 20, use the data in the table at the right. 17....
Determine the mean, median, mode and midrange of the set of data. 5,7, 20, 7, 10,...
 Determine the mean, median, mode and midrange of the set of data. 5,7, 20, 7, 10, 7, 19, 16 What is the mean? (Round to the nearest tenth as needed.) What is the median? (Round to the nearest tenth as needed) What is the mode? Select the correct choice below and fill in any answer boxes within your choice. OA (Use a comma to separate answers as needed.) OB. There is no mode. What is the midrange? (Round to the...
Data Table The scatterplot to the right and the data table below show, for 2008 cars,...
 Data Table The scatterplot to the right and the data table below show, for 2008 cars, the carbon footprint (tons of CO2 per year) vs. highway mileage for 20 family sedans. a) The correlation is - 0.740. Describe the association. b) Are the assumptions and conditions met for finding a correlation? c) Using technology, find the correlation of the data when the car with the lowest carbon footprint and highest highway mpg is not included with the others. Explain why...
Styles You need to use the data from Week 3 and based on the frequency table...
 Styles You need to use the data from Week 3 and based on the frequency table of this data, you need to create the required visuals including the pi chart and the histogram Infection Class Frequency 2015 18 Infections 6-81 Hospital 82-156 89 1 157-231 58 232-306 1 3 96 4 206 31 Check for Outliers 6 16 88.25 IQR 249 7 Lower -102.875 79 250.125 Upper 29 9 10 Create at least three visuals using your data. Visuals must...
Question For the following data: 24 13 28 1525 29 15 4 910 17 22 33...
 Question For the following data: 24 13 28 1525 29 15 4 910 17 22 33 17 16 32 11 12 1820 13 27 1822 20 14 2614 19 19 4031 172123 26 1824 21 27 i. Compile a grouped frequency distribution where the lower limit of the first class is 5 and the class size for all the classes is 5 (5 marks) i. Draw the histogram ii Compute the mode for the grouped data. iv. Compute the median...
7. Given the data set (20 points) 101 2 13 17 19 23 73 79 83 89 101 103 107109 113 97 Compute the...
 need help with m-t please
7. Given the data set (20 points) 101 2 13 17 19 23 73 79 83 89 101 103 107109 113 97 Compute the following a. Mean . b. Mode O c. Median d. Standard deviation 3o 10 e. Variance 13o3.1 f. Rangel g. Min 2 h. Max 1(3 k.Q3의 I IQR (0 m. Interval for non-outliers n. The 5-number summary o. What is the skewness? p. Is it skewed to the left or right_?...
need help with m-t please
7. Given the data set (20 points) 101 2 13 17 19 23 73 79 83 89 101 103 107109 113 97 Compute the following a. Mean . b. Mode O c. Median d. Standard deviation 3o 10 e. Variance 13o3.1 f. Rangel g. Min 2 h. Max 1(3 k.Q3의 I IQR (0 m. Interval for non-outliers n. The 5-number summary o. What is the skewness? p. Is it skewed to the left or right_?...
questions from 10 to 19 Find the outlier in the set of data. 10. 15, 35,...
 questions from 10 to 19
Find the outlier in the set of data. 10. 15, 35, 10, 22, 13, 18, 19, 14 11. The scores on an exam are normally distributed, with a nean of 81 and a standard deviation of 10. What percent of the scores are less than 917 12. A grocery store will only accept yellow onions that are at least 3.25 in. n diameter. A grower has a crop of onions with diameters that are normally...
questions from 10 to 19
Find the outlier in the set of data. 10. 15, 35, 10, 22, 13, 18, 19, 14 11. The scores on an exam are normally distributed, with a nean of 81 and a standard deviation of 10. What percent of the scores are less than 917 12. A grocery store will only accept yellow onions that are at least 3.25 in. n diameter. A grower has a crop of onions with diameters that are normally...
17 b, 18, and 21 please and show all work. c) Construct a cumulative distribution table...
 17 b, 18, and 21 please and show all work.
c) Construct a cumulative distribution table 17) The following table data are characteristics of voting age population regarding a recent election Males Fem ales Voted 230 370 Did not vote 400 240 a) When a person is chosen at random, find the probability that the person did not vote, given that the person is female b) When a person is chosen at random, find the probability that the person is...
17 b, 18, and 21 please and show all work.
c) Construct a cumulative distribution table 17) The following table data are characteristics of voting age population regarding a recent election Males Fem ales Voted 230 370 Did not vote 400 240 a) When a person is chosen at random, find the probability that the person did not vote, given that the person is female b) When a person is chosen at random, find the probability that the person is...
Question 2 ases 5 pts Je Use the confidence level and sample data to find a...
 Question 2 ases 5 pts Je Use the confidence level and sample data to find a confidence interval for estimating the population u. Find the margin of error E and round your answer to the nearest tenth. n 49, = 87,5 - 12: 90% confidence Question 4 5 pts Use the confidence level and sample data to find a confidence interval for estimating the population p. Round your answer to the nearest tenth, if necessary. Test scores: n - 100...
Experiment Sd 2. Use the data in Table 1 to calculate the percent change in amplitude...
 Experiment Sd 2. Use the data in Table 1 to calculate the percent change in amplitude (Am ) activity that occurs between the 0-20 sand 60-80 intervals. Do the same for What accounts for the difference in the percent change observed in grip streng the two time intervals? change in amplitude (AmV) in electrical intervals. Do the same for grip strength. age observed in grip strength and Am V for 3. Compare mean grip strengths and Am V for the...
please do question 20 and write clearly ping, Exploring, and Comparing Data In Exercises 17-20, use the following ce...
 please do question 20 and write clearly
ping, Exploring, and Comparing Data In Exercises 17-20, use the following cell phone airport data speeds (Mbps) to the given data speed. Percentiles. from Sprint. Find the percentile corresponding 0.3 0.3 0.4 0.4 0.4 0.3 0.3 0.3 0.3 0.2 0.7 0.8 1.0 0.6 0.6 0.5 0.5 0.5 0.5 0.5 2.3 2.4 2.1 2.1 1.6 1.6 1.2 1.2 1.1 1.1 4,0 4.0 3.4 3.6 3,8 3.2 2.7 2.7 2.7 2.5 15.2 30.4 13.0 15.1...
please do question 20 and write clearly
ping, Exploring, and Comparing Data In Exercises 17-20, use the following cell phone airport data speeds (Mbps) to the given data speed. Percentiles. from Sprint. Find the percentile corresponding 0.3 0.3 0.4 0.4 0.4 0.3 0.3 0.3 0.3 0.2 0.7 0.8 1.0 0.6 0.6 0.5 0.5 0.5 0.5 0.5 2.3 2.4 2.1 2.1 1.6 1.6 1.2 1.2 1.1 1.1 4,0 4.0 3.4 3.6 3,8 3.2 2.7 2.7 2.7 2.5 15.2 30.4 13.0 15.1...
 Determine the mean, median, mode and midrange of the set of data. 5,7, 20, 7, 10, 7, 19, 16 What is the mean? (Round to the nearest tenth as needed.) What is the median? (Round to the nearest tenth as needed) What is the mode? Select the correct choice below and fill in any answer boxes within your choice. OA (Use a comma to separate answers as needed.) OB. There is no mode. What is the midrange? (Round to the...
 Data Table The scatterplot to the right and the data table below show, for 2008 cars, the carbon footprint (tons of CO2 per year) vs. highway mileage for 20 family sedans. a) The correlation is - 0.740. Describe the association. b) Are the assumptions and conditions met for finding a correlation? c) Using technology, find the correlation of the data when the car with the lowest carbon footprint and highest highway mpg is not included with the others. Explain why...
 Styles You need to use the data from Week 3 and based on the frequency table of this data, you need to create the required visuals including the pi chart and the histogram Infection Class Frequency 2015 18 Infections 6-81 Hospital 82-156 89 1 157-231 58 232-306 1 3 96 4 206 31 Check for Outliers 6 16 88.25 IQR 249 7 Lower -102.875 79 250.125 Upper 29 9 10 Create at least three visuals using your data. Visuals must...
 Question For the following data: 24 13 28 1525 29 15 4 910 17 22 33 17 16 32 11 12 1820 13 27 1822 20 14 2614 19 19 4031 172123 26 1824 21 27 i. Compile a grouped frequency distribution where the lower limit of the first class is 5 and the class size for all the classes is 5 (5 marks) i. Draw the histogram ii Compute the mode for the grouped data. iv. Compute the median...
 need help with m-t please
7. Given the data set (20 points) 101 2 13 17 19 23 73 79 83 89 101 103 107109 113 97 Compute the following a. Mean . b. Mode O c. Median d. Standard deviation 3o 10 e. Variance 13o3.1 f. Rangel g. Min 2 h. Max 1(3 k.Q3의 I IQR (0 m. Interval for non-outliers n. The 5-number summary o. What is the skewness? p. Is it skewed to the left or right_?...
need help with m-t please
7. Given the data set (20 points) 101 2 13 17 19 23 73 79 83 89 101 103 107109 113 97 Compute the following a. Mean . b. Mode O c. Median d. Standard deviation 3o 10 e. Variance 13o3.1 f. Rangel g. Min 2 h. Max 1(3 k.Q3의 I IQR (0 m. Interval for non-outliers n. The 5-number summary o. What is the skewness? p. Is it skewed to the left or right_?...
 questions from 10 to 19
Find the outlier in the set of data. 10. 15, 35, 10, 22, 13, 18, 19, 14 11. The scores on an exam are normally distributed, with a nean of 81 and a standard deviation of 10. What percent of the scores are less than 917 12. A grocery store will only accept yellow onions that are at least 3.25 in. n diameter. A grower has a crop of onions with diameters that are normally...
questions from 10 to 19
Find the outlier in the set of data. 10. 15, 35, 10, 22, 13, 18, 19, 14 11. The scores on an exam are normally distributed, with a nean of 81 and a standard deviation of 10. What percent of the scores are less than 917 12. A grocery store will only accept yellow onions that are at least 3.25 in. n diameter. A grower has a crop of onions with diameters that are normally...
 17 b, 18, and 21 please and show all work.
c) Construct a cumulative distribution table 17) The following table data are characteristics of voting age population regarding a recent election Males Fem ales Voted 230 370 Did not vote 400 240 a) When a person is chosen at random, find the probability that the person did not vote, given that the person is female b) When a person is chosen at random, find the probability that the person is...
17 b, 18, and 21 please and show all work.
c) Construct a cumulative distribution table 17) The following table data are characteristics of voting age population regarding a recent election Males Fem ales Voted 230 370 Did not vote 400 240 a) When a person is chosen at random, find the probability that the person did not vote, given that the person is female b) When a person is chosen at random, find the probability that the person is...
 Question 2 ases 5 pts Je Use the confidence level and sample data to find a confidence interval for estimating the population u. Find the margin of error E and round your answer to the nearest tenth. n 49, = 87,5 - 12: 90% confidence Question 4 5 pts Use the confidence level and sample data to find a confidence interval for estimating the population p. Round your answer to the nearest tenth, if necessary. Test scores: n - 100...
 Experiment Sd 2. Use the data in Table 1 to calculate the percent change in amplitude (Am ) activity that occurs between the 0-20 sand 60-80 intervals. Do the same for What accounts for the difference in the percent change observed in grip streng the two time intervals? change in amplitude (AmV) in electrical intervals. Do the same for grip strength. age observed in grip strength and Am V for 3. Compare mean grip strengths and Am V for the...
 please do question 20 and write clearly
ping, Exploring, and Comparing Data In Exercises 17-20, use the following cell phone airport data speeds (Mbps) to the given data speed. Percentiles. from Sprint. Find the percentile corresponding 0.3 0.3 0.4 0.4 0.4 0.3 0.3 0.3 0.3 0.2 0.7 0.8 1.0 0.6 0.6 0.5 0.5 0.5 0.5 0.5 2.3 2.4 2.1 2.1 1.6 1.6 1.2 1.2 1.1 1.1 4,0 4.0 3.4 3.6 3,8 3.2 2.7 2.7 2.7 2.5 15.2 30.4 13.0 15.1...
please do question 20 and write clearly
ping, Exploring, and Comparing Data In Exercises 17-20, use the following cell phone airport data speeds (Mbps) to the given data speed. Percentiles. from Sprint. Find the percentile corresponding 0.3 0.3 0.4 0.4 0.4 0.3 0.3 0.3 0.3 0.2 0.7 0.8 1.0 0.6 0.6 0.5 0.5 0.5 0.5 0.5 2.3 2.4 2.1 2.1 1.6 1.6 1.2 1.2 1.1 1.1 4,0 4.0 3.4 3.6 3,8 3.2 2.7 2.7 2.7 2.5 15.2 30.4 13.0 15.1...
Most questions answered within 3 hours.
-
With a lens, both the height and width of the image exhibit
magnification. With a mirror,...
asked 6 minutes ago -
What will be the equilibrium temperature when a 247 g block of
copper at 256 ∘C...
asked 7 minutes ago -
Question: A student reacts 1ml of acetic acid with 5ml (3.91
grams) of 1-Pentanol. Calculate the...
asked 11 minutes ago -
If the Marifield Steel Fabrication Company earned $
491,000in net income and paid a cash dividend...
asked 9 minutes ago -
Please provide products and a balanced equation for the
following reactants:
C7H16O + ZnCl2 + HCl...
asked 19 minutes ago -
In C++ Prompts the user to enter 5 numbers. Once the user has
entered the 5...
asked 28 minutes ago -
Ten narrow slits are equally spaced 3.50 mm apart and
illuminated with orange light of wavelength...
asked 28 minutes ago -
Let f(n) and g(n) be asymptotically positive
functions. Prove or disprove each of the following conjectures....
asked 37 minutes ago -
security_r_us contain highly sensitive information on people,
agencies etc. They plans to modernize their services by...
asked 37 minutes ago -
Consider a simple economy that has a fixed amount of land, and
where the only use...
asked 46 minutes ago -
A. How many millimoles of magnesium chloride are there in 4
liters of 0.2 M MgCl2...
asked 58 minutes ago -
Target Costing
Laser Impressions, Inc., manufactures color laser printers.
Model J20 presently sells for $450 and...
asked 1 hour ago