

Homework Answers
D. Use a Normal distribution because  is known and the data are normaly distributed.
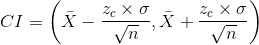
The 90% confidence for the population mean ? is computed using the following expression


A. With 90% confidance , it can be said that the population mean yards per carry is between the bounds of the confidance interval.
Add Answer to:
Use the standard normal distribution or he t-distribution to construct a 90% confidence nterval for the...
Use the standard normal distribution or the t-distribution to construct a 95% confidence interval for the...
 Use the standard normal distribution or the t-distribution to construct a 95% confidence interval for the population mean. Justify your decision. If neither distribution can In a recent season, the population standard deviation of the yards per carry for all running backs was 1.21. The yards per carry of 25 randomly selected running backs 2.8 be used, explain why. Interpret the results are shown below. Assume the yards per carry are normally distributed 2.7 3.7 4.7 7.1 3.7 5.9 2.5...
Use the standard normal distribution or the t-distribution to construct a 99% confidence interval for the...
 Use the standard normal distribution or the t-distribution to construct a 99% confidence interval for the population mean. Justify your decision. If neither distribution can be used, explain why. Interpret the results. In a recent season, the population standard deviation of the yards per carry for all running backs was 1.21. The yards per carry of 25 randomly selected running backs are shown below. Assume the yards per carry are normally distributed. 3.2 6.8 6.1 3.6 6.3 7.1 6.4 5.5...
Use the standard normal distribution or the t-distribution to construct a 99% confidence interval for the...
 Use the standard normal distribution or the t-distribution to construct a 99% confidence interval for the population mean. Justify your decision. If neither distribution can be used, explain why. Interpret the results. In a recent season, the population standard deviation of the yards per carry for all running backs was 1.27. The yards per carry of 25 randomly selected running backs are shown below. Assume the yards per carry are normally distributed. 2.9 8.4 7.2 4.3 6.8 2.7 7.2 4.8...
Use the standard normal distribution or the t-distribution to construct a 99% confidence interval for the...
 Use the standard normal distribution or the t-distribution to construct a 99% confidence interval for the population mean. Justify your decision. If neither distribution can be used, explain why. Interpret the results. In a recent season, the population standard deviation of the yards per carry for all running backs was 122. The yards per carry of 25 randomly selected running backs are shown below. Assume the yards per carry are normally distributed 22 2.9 3.9 4.6 5.5 5.5 62 75...
Use the standard normal distribution or the t distribution to construct a 9 % confidence interval...
 Use the standard normal distribution or the t distribution to construct a 9 % confidence interval for the population mean Justify your decision if neither distribution can be used, explain why Interpret the results ln a random sample of 17 mortgage institutions, the mean interest rate was 3.69% and the standard deviation was 36% Assume the iterest rates are normally distributed Which distribution should be used to construct the confidence interval? ○ A. Use a t-distribution because it is a...
6.2.36-1 Question Help Use the standard normal distribution or the t-distribution to construct a 95% confidence...
 6.2.36-1 Question Help Use the standard normal distribution or the t-distribution to construct a 95% confidence interval for the population mean. Justify your decision. If neither distribution can be used, explain why. Interpret the results. In a random sample of 15 mortgage institutions, the mean interest rate was 3.42% and the standard deviation was 0.44%. Assume the interest rates are normally distributed Which distribution should be used to construct the confidence interval? O O O O O A. Use a...
Test: Chapter 6 Confidence Intervals Submit Test This Question: 1 pt 16 of 20 (4 complete)...
 Test: Chapter 6 Confidence Intervals Submit Test This Question: 1 pt 16 of 20 (4 complete) This Test: 20 pts possible Use the standard normal distribution or the t-distribution to construct a 95 % confidence interval for the population mean. Justify your decision. If neither distribution can e used, explain why. Interpret the results. ning backs are shown below. Assume the yards per carry are normall per carry for In a re t season, the ulation standard eviation of the...
In a recent season, the population standard deviation of the yards per carry for all running...
In a recent season, the population standard deviation of the yards per carry for all running backs was 1.80. The yards per carry of 13 randomly selected running backs are listed. Assume the yards per carry are normally distributed. Use the standard normal distrubution or the t-distribution to construct a 95% confidence interval for the population mean. 4.4 3.6 3.9 4.1 4.3 5.9 5.7 5.2 3.5 1.8 7.5 2.3 2.0
This Quiz: 22 pts possit Use the standard normal distribution or the t-distribution to construct a...
 This Quiz: 22 pts possit Use the standard normal distribution or the t-distribution to construct a 99% confidence interval for the population mean. Justify your decision. If neither distribution can be used, explain why. Interpret the results. In a random sample of 40 people, the mean body mass index (BMI) was 26.9 and the standard deviation was 6.03. O A. Use a normal distribution because the sample is random, the population is normal, and is known O B. Use a...
Use the standard nomal distribution or the distribution to construct a 95% confidence interval for the...
 Use the standard nomal distribution or the distribution to construct a 95% confidence interval for the population mean. Justily your decisioni neither distribution can be used, explain why. Interpret the results In a random sample of 41 people, the mean body mass index (BMI) was 27.8 and the standard deviation was 6.11 Which distribution should be used to construct the confidence interval? Choose the correct answer below. O A Use a distribution because the sample is random, na 30, and...
 Use the standard normal distribution or the t-distribution to construct a 95% confidence interval for the population mean. Justify your decision. If neither distribution can In a recent season, the population standard deviation of the yards per carry for all running backs was 1.21. The yards per carry of 25 randomly selected running backs 2.8 be used, explain why. Interpret the results are shown below. Assume the yards per carry are normally distributed 2.7 3.7 4.7 7.1 3.7 5.9 2.5...
 Use the standard normal distribution or the t-distribution to construct a 99% confidence interval for the population mean. Justify your decision. If neither distribution can be used, explain why. Interpret the results. In a recent season, the population standard deviation of the yards per carry for all running backs was 1.21. The yards per carry of 25 randomly selected running backs are shown below. Assume the yards per carry are normally distributed. 3.2 6.8 6.1 3.6 6.3 7.1 6.4 5.5...
 Use the standard normal distribution or the t-distribution to construct a 99% confidence interval for the population mean. Justify your decision. If neither distribution can be used, explain why. Interpret the results. In a recent season, the population standard deviation of the yards per carry for all running backs was 1.27. The yards per carry of 25 randomly selected running backs are shown below. Assume the yards per carry are normally distributed. 2.9 8.4 7.2 4.3 6.8 2.7 7.2 4.8...
 Use the standard normal distribution or the t-distribution to construct a 99% confidence interval for the population mean. Justify your decision. If neither distribution can be used, explain why. Interpret the results. In a recent season, the population standard deviation of the yards per carry for all running backs was 122. The yards per carry of 25 randomly selected running backs are shown below. Assume the yards per carry are normally distributed 22 2.9 3.9 4.6 5.5 5.5 62 75...
 Use the standard normal distribution or the t distribution to construct a 9 % confidence interval for the population mean Justify your decision if neither distribution can be used, explain why Interpret the results ln a random sample of 17 mortgage institutions, the mean interest rate was 3.69% and the standard deviation was 36% Assume the iterest rates are normally distributed Which distribution should be used to construct the confidence interval? ○ A. Use a t-distribution because it is a...
 6.2.36-1 Question Help Use the standard normal distribution or the t-distribution to construct a 95% confidence interval for the population mean. Justify your decision. If neither distribution can be used, explain why. Interpret the results. In a random sample of 15 mortgage institutions, the mean interest rate was 3.42% and the standard deviation was 0.44%. Assume the interest rates are normally distributed Which distribution should be used to construct the confidence interval? O O O O O A. Use a...
 Test: Chapter 6 Confidence Intervals Submit Test This Question: 1 pt 16 of 20 (4 complete) This Test: 20 pts possible Use the standard normal distribution or the t-distribution to construct a 95 % confidence interval for the population mean. Justify your decision. If neither distribution can e used, explain why. Interpret the results. ning backs are shown below. Assume the yards per carry are normall per carry for In a re t season, the ulation standard eviation of the...
 This Quiz: 22 pts possit Use the standard normal distribution or the t-distribution to construct a 99% confidence interval for the population mean. Justify your decision. If neither distribution can be used, explain why. Interpret the results. In a random sample of 40 people, the mean body mass index (BMI) was 26.9 and the standard deviation was 6.03. O A. Use a normal distribution because the sample is random, the population is normal, and is known O B. Use a...
 Use the standard nomal distribution or the distribution to construct a 95% confidence interval for the population mean. Justily your decisioni neither distribution can be used, explain why. Interpret the results In a random sample of 41 people, the mean body mass index (BMI) was 27.8 and the standard deviation was 6.11 Which distribution should be used to construct the confidence interval? Choose the correct answer below. O A Use a distribution because the sample is random, na 30, and...
Most questions answered within 3 hours.
-
Write a c/c++ program to read a list of students from a file and
create a...
asked 50 seconds ago -
Identify two different methods for collecting data in
qualitative research. What are the benefits and challenges...
asked 1 minute ago -
I am suppose to have my array before the main class but I am
getting the...
asked 3 minutes ago -
Your task is to design the page table for the 32bit Pentium
microprocessor. Answer the following...
asked 9 minutes ago -
The Paradise Shoes Company has estimated its weekly TVC function
from data collected over the past...
asked 8 minutes ago -
A researcher wishes to study the cumulative effects of several
combinations of HIV drugs. There are...
asked 8 minutes ago -
Although Epicurus advocates pursuing pleasure for the
good life, discuss a few reasons why he does...
asked 25 minutes ago -
Problem 1: Present entries to record the selected transactions
described below:
(a)
Issued $2,790,000 of 5-year,...
asked 32 minutes ago -
Using technology to support HR activities increases:
a.
the efficiency of the administrative HR functions.
b....
asked 33 minutes ago -
1. List the features used to classify leaf
types.
2. List some characteristics that are shared...
asked 38 minutes ago -
The three elements of Value Proposition, Key Customers, and
Capabilities operate within an environment. Which of...
asked 40 minutes ago -
Katelynn, a physician, earns $200,000 from her medical practice
in the current year. She receives $45,000...
asked 48 minutes ago