
Homework Answers


Add Answer to:
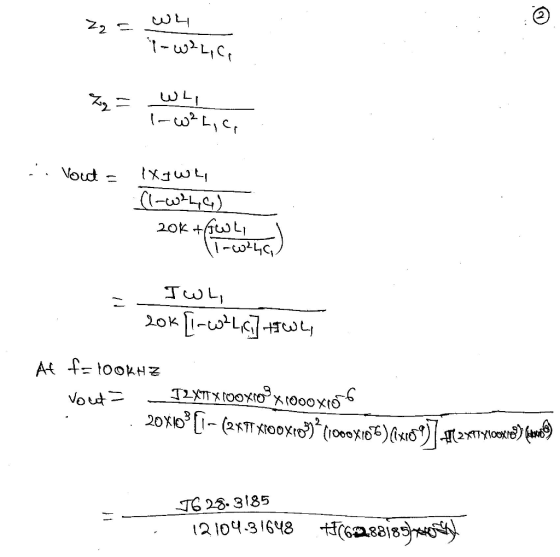
Problem 2. Determine and graph the output voltage magnitude, and phase versus frequency for the circuit...
Determine and graph the output voltage magnitude, and phase versus frequency for the circuit shown below....
 Determine and graph the output voltage magnitude, and phase versus frequency for the circuit shown below. The voltage source Vi (t) -1 sin (wt) volts. In your numerical calculations, limit the frequency range from 100 KHz to 250 KHz. out R1 20k 1000uH V1 C11n L1 0
L1 s] CI ?2 s2 In the circuit, the amplitude and phase of the voltage source...
 L1 s] CI ?2 s2 In the circuit, the amplitude and phase of the voltage source Vs1 are 120 V and 0.4 rad, those of the voltage source Vs2 are 230 V and 0.5 rad, the voltage frequency is 20 kHz; 36 mH, L2 20 mH, C1 2.5 nF R1-3 kOhm, R2 7 kOhm, R36 kOhm, L1 Find the impedance of inductor L1 Real part of impedance (Ohm) Submit Answer Tries 0/3 Impaginary part of impedance (Ohm): Submit Answer Tries...
WIth the following two circuits (Circuit A and B), please derive the equations for the magnitude...
 WIth the following two circuits (Circuit A and B), please derive
the equations for the magnitude and phase of the capacitor and
inductor voltage as a function of angular frequency ω, and plot the
values in MATLAB or Excel.
Both circuits have the voltage set to AC Amplitude 1 and an AC
Phase to 0 degrees.
Circuit A:
Circuit B:
Thanks.
R1 100 V1 L1 AC 1 0 10mH
WIth the following two circuits (Circuit A and B), please derive
the equations for the magnitude and phase of the capacitor and
inductor voltage as a function of angular frequency ω, and plot the
values in MATLAB or Excel.
Both circuits have the voltage set to AC Amplitude 1 and an AC
Phase to 0 degrees.
Circuit A:
Circuit B:
Thanks.
R1 100 V1 L1 AC 1 0 10mH
2.2kn 10nF Fig. 1. Resistive-capacitive circuit for learning how to measure magnitude and phase shift. 1....
 2.2kn 10nF Fig. 1. Resistive-capacitive circuit for learning how to measure magnitude and phase shift. 1. Hand Calculations (in a manner suitable for submission) For the circuit in Fig. 1 with f = 7.2 kHz and a source t) = 1.0 cos (Zrf-t|v applied at the circuit input (between points A and D), calculate by hand the voltage vi(t) at the input and the voltage v2(t) at the output (between points B and D).
To describe the phase relation between current and voltage, we use particular words: In the circuit...
 To describe the phase relation between current and voltage, we use particular words: In the circuit represented by these phasors, the current the voltage, leads lags is perpendicular to is out of phase with The appropriate answer here is B although C and D are also correct. Explain what answer B means: A capacitor has a peak current of 330 mu A when the peak voltage at f = 250 kHz is 2.2 V. What is the capacitance C? If...
2. In the circuit below, R1 = 10k, R2 : magnitude is applied to the input....
 2. In the circuit below, R1 = 10k, R2 : magnitude is applied to the input. Find V(t) at the output and sketch it. Your sketch should be quantitatively correct, that is, it should have labeled V and t axes. Strongly suggested: solve by first finding the Thévenin equivalent of the source voltage and resistor network. 20k and C = 0.1µF. At t = 0, a step function of 10 V Input (problem 3) R, 10V- IN R2 C, OUT...
The alternating signal with an amplitude of 0.9 V, a frequency of 1 KHz, and a phase of -22.5° is o.TV dc b.as. Try connecting this signal to a load resistance of 50 Q to test the waveform 1.E...
 The alternating signal with an amplitude of 0.9 V, a frequency of 1 KHz, and a phase of -22.5° is o.TV dc b.as. Try connecting this signal to a load resistance of 50 Q to test the waveform 1.Express circuit as CAD drawing 2.Show output graph through Transient analysis in PSPICE 3.Calculate the instantaneous value at 0.1 second and compare it with the result of 2 4.When connecting the signal to the A and B terminals of the voltage distribution...
Voltage Pulse Response of a RC Circuit PULSE VOLTAGE Label Display Fut Pins Variant Pulau R1...
 Voltage Pulse Response of a RC Circuit PULSE VOLTAGE Label Display Fut Pins Variant Pulau R1 Pue with 1kg V1 OV 10V 2ms 4ms 1F Distortion frecuenche = Cancel Help f) For the circuit and Pulse Voltage parameters shown above, enter the circuit using Multisim Schematic Capture. g) Simulate using Transient mode with a graphical output. a. Explain the resulting graphical waveform by answering the following questions: i. Why is the amplitude look like a "sawtooth" shape? ii. What is...
In the circuit below the oscillator outputs a voltage of 3 Vome at a frequency of...
 In the circuit below the oscillator outputs a voltage of 3 Vome at a frequency of 1 KHz into a series combination of a 2000 Ohm resistor and an 80 nF capacitor. Calculate the output voltage that appears across the capacitor, and calculate the phase relationship between this voltage and the input voltage. Show a phasor diagram for these voltages and indicate which voltage is ahead in phase of the other Circuits of this type have a name - what...
Determine only the magnitude of the voltage phasor V1 V3 L1 2 RI R2 Considere: Vs(t)...
 Determine only the magnitude of the voltage phasor V1
V3 L1 2 RI R2 Considere: Vs(t) = 66cos(13t+ 180) V R1= 35?, R2=46?, L1=7H, C1 = 6F
Determine only the magnitude of the voltage phasor V1
V3 L1 2 RI R2 Considere: Vs(t) = 66cos(13t+ 180) V R1= 35?, R2=46?, L1=7H, C1 = 6F
 Determine and graph the output voltage magnitude, and phase versus frequency for the circuit shown below. The voltage source Vi (t) -1 sin (wt) volts. In your numerical calculations, limit the frequency range from 100 KHz to 250 KHz. out R1 20k 1000uH V1 C11n L1 0
 L1 s] CI ?2 s2 In the circuit, the amplitude and phase of the voltage source Vs1 are 120 V and 0.4 rad, those of the voltage source Vs2 are 230 V and 0.5 rad, the voltage frequency is 20 kHz; 36 mH, L2 20 mH, C1 2.5 nF R1-3 kOhm, R2 7 kOhm, R36 kOhm, L1 Find the impedance of inductor L1 Real part of impedance (Ohm) Submit Answer Tries 0/3 Impaginary part of impedance (Ohm): Submit Answer Tries...
 WIth the following two circuits (Circuit A and B), please derive
the equations for the magnitude and phase of the capacitor and
inductor voltage as a function of angular frequency ω, and plot the
values in MATLAB or Excel.
Both circuits have the voltage set to AC Amplitude 1 and an AC
Phase to 0 degrees.
Circuit A:
Circuit B:
Thanks.
R1 100 V1 L1 AC 1 0 10mH
WIth the following two circuits (Circuit A and B), please derive
the equations for the magnitude and phase of the capacitor and
inductor voltage as a function of angular frequency ω, and plot the
values in MATLAB or Excel.
Both circuits have the voltage set to AC Amplitude 1 and an AC
Phase to 0 degrees.
Circuit A:
Circuit B:
Thanks.
R1 100 V1 L1 AC 1 0 10mH
 2.2kn 10nF Fig. 1. Resistive-capacitive circuit for learning how to measure magnitude and phase shift. 1. Hand Calculations (in a manner suitable for submission) For the circuit in Fig. 1 with f = 7.2 kHz and a source t) = 1.0 cos (Zrf-t|v applied at the circuit input (between points A and D), calculate by hand the voltage vi(t) at the input and the voltage v2(t) at the output (between points B and D).
 To describe the phase relation between current and voltage, we use particular words: In the circuit represented by these phasors, the current the voltage, leads lags is perpendicular to is out of phase with The appropriate answer here is B although C and D are also correct. Explain what answer B means: A capacitor has a peak current of 330 mu A when the peak voltage at f = 250 kHz is 2.2 V. What is the capacitance C? If...
 2. In the circuit below, R1 = 10k, R2 : magnitude is applied to the input. Find V(t) at the output and sketch it. Your sketch should be quantitatively correct, that is, it should have labeled V and t axes. Strongly suggested: solve by first finding the Thévenin equivalent of the source voltage and resistor network. 20k and C = 0.1µF. At t = 0, a step function of 10 V Input (problem 3) R, 10V- IN R2 C, OUT...
 The alternating signal with an amplitude of 0.9 V, a frequency of 1 KHz, and a phase of -22.5° is o.TV dc b.as. Try connecting this signal to a load resistance of 50 Q to test the waveform 1.Express circuit as CAD drawing 2.Show output graph through Transient analysis in PSPICE 3.Calculate the instantaneous value at 0.1 second and compare it with the result of 2 4.When connecting the signal to the A and B terminals of the voltage distribution...
 Voltage Pulse Response of a RC Circuit PULSE VOLTAGE Label Display Fut Pins Variant Pulau R1 Pue with 1kg V1 OV 10V 2ms 4ms 1F Distortion frecuenche = Cancel Help f) For the circuit and Pulse Voltage parameters shown above, enter the circuit using Multisim Schematic Capture. g) Simulate using Transient mode with a graphical output. a. Explain the resulting graphical waveform by answering the following questions: i. Why is the amplitude look like a "sawtooth" shape? ii. What is...
 In the circuit below the oscillator outputs a voltage of 3 Vome at a frequency of 1 KHz into a series combination of a 2000 Ohm resistor and an 80 nF capacitor. Calculate the output voltage that appears across the capacitor, and calculate the phase relationship between this voltage and the input voltage. Show a phasor diagram for these voltages and indicate which voltage is ahead in phase of the other Circuits of this type have a name - what...
 Determine only the magnitude of the voltage phasor V1
V3 L1 2 RI R2 Considere: Vs(t) = 66cos(13t+ 180) V R1= 35?, R2=46?, L1=7H, C1 = 6F
Determine only the magnitude of the voltage phasor V1
V3 L1 2 RI R2 Considere: Vs(t) = 66cos(13t+ 180) V R1= 35?, R2=46?, L1=7H, C1 = 6F
Most questions answered within 3 hours.
-
Sodium hydroxide is a strong base and ammonium hydroxide is a
weak base. Which of the...
asked 1 minute ago -
Glycerol, C3H8O3, is a substance used extensively in the
manufacture of cosmetics, foodstuffs, antifreeze, and plastics....
asked 4 minutes ago -
After moving through Chapter 1 of our textbook, what is a social
issue/area of concern that...
asked 5 minutes ago -
Please complete the implementation of the four functions IN
C.
//************************************************************************************/
//
// countNumberofOnes
//
//...
asked 25 minutes ago -
A memory test consists of 35 tasks. Each task is graded on a
scale of 1...
asked 6 minutes ago -
Construction Cost Analysis and Estimating:
A project requires 17,000 allowed hours. Location of the work is...
asked 14 minutes ago -
1: In 802.11b, Access Point (AP) delivers a nonce to the Station
(STA). This nonce is...
asked 15 minutes ago -
calculate change in entropy and change in enthalpy for freezing
1 mol of water at -10C...
asked 21 minutes ago -
In your opinion, did anyone "win" the Cold War? If no, why? If
yes, who won...
asked 25 minutes ago -
a) Determine the saturation dissolved oxygen concentration at
sea-level at 1 atm and 20° C in...
asked 23 minutes ago -
Shown below are the budgeted sales for ABC Company for
the next six months:
Sales...
asked 30 minutes ago -
A balance sheet shows exactly where a business stands at any
given point in time. It...
asked 31 minutes ago