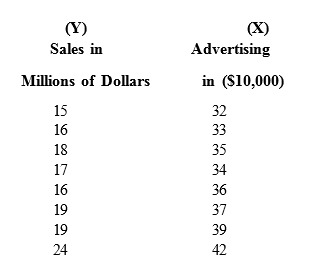
The following data represent a company's yearly sales volume and its advertising expenditure over a period of 8 years.
- Develop a scatter diagram of sales versus advertising and explain what it shows regarding the relationship between sales and advertising. Make sure your axes are labeled and that you have the axes correct (notice that x and y are above the labels). The graph should have a title that mentions the two variables.
- Use the method of least squares to compute an estimated regression line between sales and advertising OR just show it on the graph along with your r-squared value..
- If the company's advertising expenditure is $200,000, what are the predicted sales? Give the answer in dollars. (This is found using algebra and the equation of the trendline / regression line - make sure to watch your units)
- What does the slope of the estimated regression line indicate?
Homework Answers
To develop a scatter diagram of Sales (Y) versus advertising we measure Y (which is called response variable) on the vertical axis and advertising (X) along the horizontal axis. The scatter diagram is shown in the following diagram.

The corresponding observations of Y and X reveals approximately a linear path. therefore, the scatter diagram reveals that a linear relationship between sales and advertising and hence indicating that a linear regression model might be appropriate.

Add Answer to:
The following data
represent a company's yearly sales volume and its advertising
expenditure over a period...
In cell C6, insert a Scatter Chart for the Returns Completed versus Return Price data from...
 In
cell C6, insert a Scatter Chart for the Returns
Completed versus Return Price data from the Data
worksheet. You may be used to seeing Price placed on the Y-axis
from other economics courses, but in this problem we are using
price as the independent variable.
Inserting Chart
Select the Scatter chart from the provided chart options in the
Charts group of the Insert tab of the Ribbon.
Selecting Data Series
Then choose Select Data in the Design tab on...
In
cell C6, insert a Scatter Chart for the Returns
Completed versus Return Price data from the Data
worksheet. You may be used to seeing Price placed on the Y-axis
from other economics courses, but in this problem we are using
price as the independent variable.
Inserting Chart
Select the Scatter chart from the provided chart options in the
Charts group of the Insert tab of the Ribbon.
Selecting Data Series
Then choose Select Data in the Design tab on...
Du Lissuil Aug 19, 2019 1. List the variables Sales and Ads in the data file...
 Du Lissuil Aug 19, 2019 1. List the variables Sales and Ads in the data file salad.xlsx on the LMS networks. Sales is the number of boxes of Cheerios sold by Kellogs during 12 sample periods and Ads is the expenditure on Cheerios advertising in million real US dollars. (a) Scatterplot Sales versus Ads. Please discuss the plot briefly. (b) Fit the following linear regression model by using the command Im( sales ads) in R. Sales, = Bo + B;...
Section 1 Tube [FeSCN^+] M Absorbance 1 0.0005 0.016 2 0.0011 0.0422 3 0.00367 0.0917 4...
Section 1 Tube [FeSCN^+] M Absorbance 1 0.0005 0.016 2 0.0011 0.0422 3 0.00367 0.0917 4 0.00727 0.224 5 0.00965 0.267 6 0.0137 0.398 Part B unknown sol. 0.175 SCENARIO: Five standard solutions containing different known concentrations of an iron (II) thiocyanate (FeSCN+ ) complex are analyzed using spectrophotometry, a technique which measures the quantity of light absorbed by the solution as a function of the concentration of the analyte in solution (in this case, FeSCN+ ). The results of...
BBA 403 TEST 3: Name: Score:_ SOLVE AND THOROUGHLY INTERPRET YOUR ANSWER 1. A marketing manager conducted a study to determine whether there is a linear relationship between many spent on adverti...
 BBA 403 TEST 3: Name: Score:_ SOLVE AND THOROUGHLY INTERPRET YOUR ANSWER 1. A marketing manager conducted a study to determine whether there is a linear relationship between many spent on advertising and company sales. The data are shown on the table below. Display the data in a scatter plot, calculate the correlation coefficient, state a conclusion, and interpret the result Adverstising Company Expense, (1000s of s) (1000s of ) 2.4 16 2.0 26 14 1.6 2.0 2.2 184 220...
Clean Industries produces Fresh, a brand of liquid laundry detergent. In order to better manage its...
 Clean Industries produces Fresh, a brand of liquid laundry detergent. In order to better manage its inventory and make revenue projections, the company would like to better predict the quantity demanded for its product. The company has gathered data concerning the quantity demanded for Fresh, along with variables believed to affect the demand for Fresh, over the last 30 sales periods. The following information was collected: Variable Description Name DEMAND sales pericd PRICE The quantity demanded for the large size...
from part 5-12 plz dont do 1-4 BUNUS Assignment! A Sample Data AnalySIS III Licer Please...
 from part 5-12 plz dont do 1-4
BUNUS Assignment! A Sample Data AnalySIS III Licer Please answer all of the following questions. Make sure you show all your work, providing snapshots from Excel as well as listing all formulas and relevant explanation, as needed. We are interested in exploring the relationship between the income of professors (measured in thousands of dollars) and the number of years they have been employed by the university. We collect the following data from eight...
from part 5-12 plz dont do 1-4
BUNUS Assignment! A Sample Data AnalySIS III Licer Please answer all of the following questions. Make sure you show all your work, providing snapshots from Excel as well as listing all formulas and relevant explanation, as needed. We are interested in exploring the relationship between the income of professors (measured in thousands of dollars) and the number of years they have been employed by the university. We collect the following data from eight...
Question 1: Wendy's Happy Homes Inc manufactures Home Appliances. Monthly sales of Wendy's Washer...
 this is a really long assignment and I need help
Question 1: Wendy's Happy Homes Inc manufactures Home Appliances. Monthly sales of Wendy's Washers and Dryer Sets for a nine month period were as follows: MONTH Washer and Dryer Sales 490 480 450 500 480 470 490 520 530 January February March April May June July August September Forecast October sales using 1) A four-month moving average 2) a six-month moving average 3. Compute the MAD for each forecast method...
this is a really long assignment and I need help
Question 1: Wendy's Happy Homes Inc manufactures Home Appliances. Monthly sales of Wendy's Washers and Dryer Sets for a nine month period were as follows: MONTH Washer and Dryer Sales 490 480 450 500 480 470 490 520 530 January February March April May June July August September Forecast October sales using 1) A four-month moving average 2) a six-month moving average 3. Compute the MAD for each forecast method...
Part 1: Hypothesis Testing (25 points) Step 1: Suppose you are asked to conduct a hypothesis...
Part 1: Hypothesis Testing (25 points) Step 1: Suppose you are asked to conduct a hypothesis test on the population mean. What type of hypothesis test would you use? What assumptions do you need to make about the process when you are conducting a hypothesis test on the population mean in order for your results to be valid? This needs to be at least one (1) paragraph in length. Note a paragraph contains at least three complete sentences. Watch your...
Question 1: Wendy's Happy Homes Inc manufactures Home Appliances. Monthly sales of Wendy's Washer...
 Question 1: Wendy's Happy Homes Inc manufactures Home Appliances. Monthly sales of Wendy's Washers and Dryer Sets for a nine month period were as follows: MONTH Washer and Dryer Sales 490 480 450 500 480 470 490 520 530 January February March April May June July August September Forecast October sales using 1) A four-month moving average 2) a six-month moving average 3. Compute the MAD for each forecast method you used Actual October sales were 320 nits. 4) Which...
2.) The data set named "HW 6.2" contains a random sample of 35 movies released in 2008 collected from the Internet Movie Database (IMDb). The goal of this problem is to explore if the informa...
 2.) The data set named "HW 6.2" contains a random sample of 35 movies released in 2008 collected from the Internet Movie Database (IMDb). The goal of this problem is to explore if the information available soon after a movie's theatrical release can successfully predict total revenue. All dollar amounts (i.e., variables "Budget", "Opening", and "USRevenue") are measured in millions of dollars. . Investigate the relationship between the explanatory variable "Budget" and response variable "USRevenue" by doing the following: a....
 In
cell C6, insert a Scatter Chart for the Returns
Completed versus Return Price data from the Data
worksheet. You may be used to seeing Price placed on the Y-axis
from other economics courses, but in this problem we are using
price as the independent variable.
Inserting Chart
Select the Scatter chart from the provided chart options in the
Charts group of the Insert tab of the Ribbon.
Selecting Data Series
Then choose Select Data in the Design tab on...
In
cell C6, insert a Scatter Chart for the Returns
Completed versus Return Price data from the Data
worksheet. You may be used to seeing Price placed on the Y-axis
from other economics courses, but in this problem we are using
price as the independent variable.
Inserting Chart
Select the Scatter chart from the provided chart options in the
Charts group of the Insert tab of the Ribbon.
Selecting Data Series
Then choose Select Data in the Design tab on...
 Du Lissuil Aug 19, 2019 1. List the variables Sales and Ads in the data file salad.xlsx on the LMS networks. Sales is the number of boxes of Cheerios sold by Kellogs during 12 sample periods and Ads is the expenditure on Cheerios advertising in million real US dollars. (a) Scatterplot Sales versus Ads. Please discuss the plot briefly. (b) Fit the following linear regression model by using the command Im( sales ads) in R. Sales, = Bo + B;...
 BBA 403 TEST 3: Name: Score:_ SOLVE AND THOROUGHLY INTERPRET YOUR ANSWER 1. A marketing manager conducted a study to determine whether there is a linear relationship between many spent on advertising and company sales. The data are shown on the table below. Display the data in a scatter plot, calculate the correlation coefficient, state a conclusion, and interpret the result Adverstising Company Expense, (1000s of s) (1000s of ) 2.4 16 2.0 26 14 1.6 2.0 2.2 184 220...
 Clean Industries produces Fresh, a brand of liquid laundry detergent. In order to better manage its inventory and make revenue projections, the company would like to better predict the quantity demanded for its product. The company has gathered data concerning the quantity demanded for Fresh, along with variables believed to affect the demand for Fresh, over the last 30 sales periods. The following information was collected: Variable Description Name DEMAND sales pericd PRICE The quantity demanded for the large size...
 from part 5-12 plz dont do 1-4
BUNUS Assignment! A Sample Data AnalySIS III Licer Please answer all of the following questions. Make sure you show all your work, providing snapshots from Excel as well as listing all formulas and relevant explanation, as needed. We are interested in exploring the relationship between the income of professors (measured in thousands of dollars) and the number of years they have been employed by the university. We collect the following data from eight...
from part 5-12 plz dont do 1-4
BUNUS Assignment! A Sample Data AnalySIS III Licer Please answer all of the following questions. Make sure you show all your work, providing snapshots from Excel as well as listing all formulas and relevant explanation, as needed. We are interested in exploring the relationship between the income of professors (measured in thousands of dollars) and the number of years they have been employed by the university. We collect the following data from eight...
 this is a really long assignment and I need help
Question 1: Wendy's Happy Homes Inc manufactures Home Appliances. Monthly sales of Wendy's Washers and Dryer Sets for a nine month period were as follows: MONTH Washer and Dryer Sales 490 480 450 500 480 470 490 520 530 January February March April May June July August September Forecast October sales using 1) A four-month moving average 2) a six-month moving average 3. Compute the MAD for each forecast method...
this is a really long assignment and I need help
Question 1: Wendy's Happy Homes Inc manufactures Home Appliances. Monthly sales of Wendy's Washers and Dryer Sets for a nine month period were as follows: MONTH Washer and Dryer Sales 490 480 450 500 480 470 490 520 530 January February March April May June July August September Forecast October sales using 1) A four-month moving average 2) a six-month moving average 3. Compute the MAD for each forecast method...
 Question 1: Wendy's Happy Homes Inc manufactures Home Appliances. Monthly sales of Wendy's Washers and Dryer Sets for a nine month period were as follows: MONTH Washer and Dryer Sales 490 480 450 500 480 470 490 520 530 January February March April May June July August September Forecast October sales using 1) A four-month moving average 2) a six-month moving average 3. Compute the MAD for each forecast method you used Actual October sales were 320 nits. 4) Which...
 2.) The data set named "HW 6.2" contains a random sample of 35 movies released in 2008 collected from the Internet Movie Database (IMDb). The goal of this problem is to explore if the information available soon after a movie's theatrical release can successfully predict total revenue. All dollar amounts (i.e., variables "Budget", "Opening", and "USRevenue") are measured in millions of dollars. . Investigate the relationship between the explanatory variable "Budget" and response variable "USRevenue" by doing the following: a....
Most questions answered within 3 hours.
-
could someone please post clear drawings of the three structures
in the equilibrium mixture of D-glucose...
asked 2 minutes ago -
Using the Properties of Order show that 5n5 +
4n4 + 6n3 + 2n2+ n +...
asked 5 minutes ago -
What is experiential learning and how is it helpful for teaching
leadership, and interpreting group dynamics?...
asked 5 minutes ago -
A security awareness policy defines the responsibilities of
managers and information owners.
True
False
asked 6 minutes ago -
which is the equilibrium expression for the reaction
3A(g)+4B(g)<---> 2C(g)+5D(g)
asked 7 minutes ago -
Create a balanced compensation plan that you feel would
encourage a restaurant manager to be more...
asked 14 minutes ago -
Re: Human Physiology
Comment on the differences between representing V02 max as an
absolute number and...
asked 17 minutes ago -
A firm with a WACC of 10% is considering the following mutually
exclusive projects:
0
1...
asked 22 minutes ago -
. A 100.0 mL sample of 0.18 M HClO4 is titrated with 0.27 M
LiOH. Determine...
asked 45 minutes ago -
A regression equation that describes the relationship between
the amount of the bill ($) at a...
asked 1 hour ago -
exercise on VSEPR and molecular structrue.
octahedral
SeCl62-
TeCl62-
ClF62-
distorted
SeF62–
IF6–
asked 2 hours ago -
284 mL of a 0.52 M potassium hydroxide solution is added to 467
mL of a...
asked 2 hours ago