Using the table for a population answer the following questions.
data are for females only.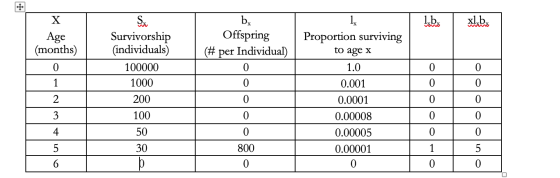
- what type of survivorship curve do you think these species has (Type I, Type II, or Type III)? Why?
- Is this species more likely to be a mouse, a bird or a butterfly? Why?
Homework Answers
a) The survivorship of the species according to the given details is Type III. The graph plotted is concave in Shape. The juveniles with high mortality and low adult mortality.it describes organisms with a high death rate (or low survivorship rate) immediately following birth.
b) no, because marine invertebrates, and most fish have a Type III survivorship curve. In a Type III curve, very few organisms survive their younger years. However, the lucky ones that make it through youth are likely to have pretty long lives after that. Species with this type of curve usually have lots of offspring at once—such as a tree releasing thousands of seeds—but don't provide much care for the offspring.
Add Answer to:
Using the table for a population answer the following questions.
data are for females only.
what...
Question 2 1.5 pts Use the cohort life table to answer the question. Age Class Survivorship...
 Question 2 1.5 pts Use the cohort life table to answer the question. Age Class Survivorship Mortality Fecundity 0-1 0.50 1-2 0.4 2-3 0.33 3-4 0.5 4.2 4-5 5-6 0.0 Assume the initial population was 1000 individuals and the ratio between males and females was 50/50. Which of the following is TRUE? SELECT ALL THAT APPLY. The age class 4-5 produced 150 offspring. Individuals in age class 2-3 were more likely to die than individuals in age class 3-4. Individuals...
can anyone help me with these questions for ecology. thanks! the 1000 IN-dN/dt A Population size...
 can
anyone help me with these questions for ecology. thanks!
the 1000 IN-dN/dt A Population size the dN/dt = IN (K-N)/K y = 164.170.1387x bio Number of individuals 10 3512 909 95209 Time FIGURE 1 29 3 10 Time years FIGURE 4 Population densities of individual species 000.01 Environmental gradient- (such as temperature or moisture) 09 FIGURE 2 9812 909 Life table of a hypothetical population FIGURE 5 00001 Total # indiv in survivorship fecundity next time period Current #...
can
anyone help me with these questions for ecology. thanks!
the 1000 IN-dN/dt A Population size the dN/dt = IN (K-N)/K y = 164.170.1387x bio Number of individuals 10 3512 909 95209 Time FIGURE 1 29 3 10 Time years FIGURE 4 Population densities of individual species 000.01 Environmental gradient- (such as temperature or moisture) 09 FIGURE 2 9812 909 Life table of a hypothetical population FIGURE 5 00001 Total # indiv in survivorship fecundity next time period Current #...
 Question 2 1.5 pts Use the cohort life table to answer the question. Age Class Survivorship Mortality Fecundity 0-1 0.50 1-2 0.4 2-3 0.33 3-4 0.5 4.2 4-5 5-6 0.0 Assume the initial population was 1000 individuals and the ratio between males and females was 50/50. Which of the following is TRUE? SELECT ALL THAT APPLY. The age class 4-5 produced 150 offspring. Individuals in age class 2-3 were more likely to die than individuals in age class 3-4. Individuals...
 can
anyone help me with these questions for ecology. thanks!
the 1000 IN-dN/dt A Population size the dN/dt = IN (K-N)/K y = 164.170.1387x bio Number of individuals 10 3512 909 95209 Time FIGURE 1 29 3 10 Time years FIGURE 4 Population densities of individual species 000.01 Environmental gradient- (such as temperature or moisture) 09 FIGURE 2 9812 909 Life table of a hypothetical population FIGURE 5 00001 Total # indiv in survivorship fecundity next time period Current #...
can
anyone help me with these questions for ecology. thanks!
the 1000 IN-dN/dt A Population size the dN/dt = IN (K-N)/K y = 164.170.1387x bio Number of individuals 10 3512 909 95209 Time FIGURE 1 29 3 10 Time years FIGURE 4 Population densities of individual species 000.01 Environmental gradient- (such as temperature or moisture) 09 FIGURE 2 9812 909 Life table of a hypothetical population FIGURE 5 00001 Total # indiv in survivorship fecundity next time period Current #...
Most questions answered within 3 hours.
-
You invested $30,000 in a mutual fund at the beginning of the
year when the NAV...
asked 59 seconds ago -
Would you expect the price elasticity of supply for guitars to
be more inelastic in the...
asked 2 minutes ago -
A snowmobile is originally at the point with position vector
30.1 m at 95.0° counterclockwise from...
asked 2 minutes ago -
MAN3240 Organizational Behavior
In one to two paragraphs
6.) How can understanding emotions make me more...
asked 10 minutes ago -
Identify one individual who, in your opinion, is an excellent
leader. List the qualities that this...
asked 8 minutes ago -
For the data set shown below, complete parts (a) through (d)
below. x 3 4 5...
asked 14 minutes ago -
A university administrator working in student housing wants to
determine if the percentage of students residing...
asked 28 minutes ago -
3). Describe human population growth that has occurred in the
past 400 years. Use terms learned...
asked 25 minutes ago -
A
projectile is blue at a target. The distance from the point of
impact to the...
asked 49 minutes ago -
Given a 32 bit processor, with 2 MB of physical RAM split into 512
frames. What...
asked 39 minutes ago -
What were the main rulings in the Supreme Court cases which are
Morgan v. Virginia (1946)...
asked 39 minutes ago -
write a five paragraph essay on how setting,
specifically culture, influences the actions of
the characters...
asked 31 minutes ago