
Homework Answers


Add Answer to:
Signal x(t) is given in the figure below. Using this information, sketch the following signals (MATLAB...
1. Suppose x(t) -3u(t+3) - u(t)+ 3H(t-3) - 5H(t-6) a. Sketch x(t). b. For the signal x(t) given, ...
 I need a Matlab code example plz
1. Suppose x(t) -3u(t+3) - u(t)+ 3H(t-3) - 5H(t-6) a. Sketch x(t). b. For the signal x(t) given, determine and sketch the following signals: ,g(t) x(t-6) g2(t) - x(3t-6) ii. s(t) x(3t-6) +2 c. Create a MATLAB script that uses a function to express x(t), and plots x(t) in the time interval- 5 < t < 8s, using a time increment of At= 0.01s. Next, use the function to graph each of the...
I need a Matlab code example plz
1. Suppose x(t) -3u(t+3) - u(t)+ 3H(t-3) - 5H(t-6) a. Sketch x(t). b. For the signal x(t) given, determine and sketch the following signals: ,g(t) x(t-6) g2(t) - x(3t-6) ii. s(t) x(3t-6) +2 c. Create a MATLAB script that uses a function to express x(t), and plots x(t) in the time interval- 5 < t < 8s, using a time increment of At= 0.01s. Next, use the function to graph each of the...
(a) Determine the Fourier transform of x(t) 26(t-1)-6(t-3) (b) Compute the convolution sum of the following signals, (6%) [696] (c) The Fourier transform of a continuous-time signal a(t) is given bel...
 (a) Determine the Fourier transform of x(t) 26(t-1)-6(t-3) (b) Compute the convolution sum of the following signals, (6%) [696] (c) The Fourier transform of a continuous-time signal a(t) is given below. Determine the [696] total energy of (t) 4 sin w (d) Determine the DC value and the average power of the following periodic signal. (6%) 0.5 0.5 (e) Determine the Nyquist rate for the following signal. (6%) x(t) = [1-0.78 cos(50nt + π/4)]2. (f) Sketch the frequency spectrum of...
2. For the signal shown in figure, draw the following signals x(t) 2 1 -1 0...
 2. For the signal shown in figure, draw the following signals x(t) 2 1 -1 0 1 2 a. x(t-5) b. x(2t+1) C. x(6-t) d. x(-t-2) e. [x(t)+x(-t)Ju(t) 3. Given x[n]=(6-1)[[n] -u[n-6]], draw the following signals a. X[n+3] b. X[3n+1] c. X[6-n) d. x 4. Draw the following signals a. X(t)=u(sin st) b. X(t)=u(t+1)-2u(t)+u(t-1) c. X(t)=r(++4)-r(1+2)+u(t)-3r(1-4)+3r(1-5) d. x(t)=2u(t)-u(1-2)+1(1-3)-2r(1-4)+2r(1-5)
Sketch the signals with the figure given below. i. x(t+1)y(t-2) ii. x(4-t)y(2t) X(t) 1 2 3...
 Sketch the signals with the figure given below.
i. x(t+1)y(t-2)
ii. x(4-t)y(2t)
X(t) 1 2 3 t -1 y(t) -2 -1 1 2 -1
Sketch the signals with the figure given below.
i. x(t+1)y(t-2)
ii. x(4-t)y(2t)
X(t) 1 2 3 t -1 y(t) -2 -1 1 2 -1
1) (Fourier Transforms each of the following signals (a - c), sketch the signal x(t), and find its Fourier Transform X(f) using the defining integral (rather than "known" transforms and prope...
 1) (Fourier Transforms each of the following signals (a - c), sketch the signal x(t), and find its Fourier Transform X(f) using the defining integral (rather than "known" transforms and properties) (a)x(t) rectt 0.5) from Definition)- For (c) r(t) = te-2, 11(1) (b) x(t)-2t rect(t)
1) (Fourier Transforms each of the following signals (a - c), sketch the signal x(t), and find its Fourier Transform X(f) using the defining integral (rather than "known" transforms and properties) (a)x(t) rectt 0.5) from...
1) (Fourier Transforms each of the following signals (a - c), sketch the signal x(t), and find its Fourier Transform X(f) using the defining integral (rather than "known" transforms and properties) (a)x(t) rectt 0.5) from Definition)- For (c) r(t) = te-2, 11(1) (b) x(t)-2t rect(t)
1) (Fourier Transforms each of the following signals (a - c), sketch the signal x(t), and find its Fourier Transform X(f) using the defining integral (rather than "known" transforms and properties) (a)x(t) rectt 0.5) from...
For the signal g(t) shown in the following figure: a. Sketch the signals: 4. i) g(20)...
 For the signal g(t) shown in the following figure: a. Sketch the signals: 4. i) g(20) ii) g(t-12) iii) g(6t) iv) g(3-t) find the energies of all the signals in part (a) b. g(t) 0.5 0 12 15 24
Kindly provide calculation and show each step. Thanks (a) Given the signal x(t) in Figure 2,...
 Kindly provide calculation and show each step. Thanks
(a) Given the signal x(t) in Figure 2, sketch the signal for: xit) 12 10 - 2- 0.2 0.4 0.6 2 14 1.6 1.8 2 0.8 Figure 2 i. x(t+2) [4 Marks] ii. x(t/3) [4 Marks] iii. x(2t) [4 Marks] iv. -X(t) [4 Marks] (b) Given the signal x(t) in Figure 3, sketch the signal for x-(2t-2): xit 25 2 1.5 1 0.5 -0.5 0.5 1 1.5 2 2.5 3.5 Figure 3...
Kindly provide calculation and show each step. Thanks
(a) Given the signal x(t) in Figure 2, sketch the signal for: xit) 12 10 - 2- 0.2 0.4 0.6 2 14 1.6 1.8 2 0.8 Figure 2 i. x(t+2) [4 Marks] ii. x(t/3) [4 Marks] iii. x(2t) [4 Marks] iv. -X(t) [4 Marks] (b) Given the signal x(t) in Figure 3, sketch the signal for x-(2t-2): xit 25 2 1.5 1 0.5 -0.5 0.5 1 1.5 2 2.5 3.5 Figure 3...
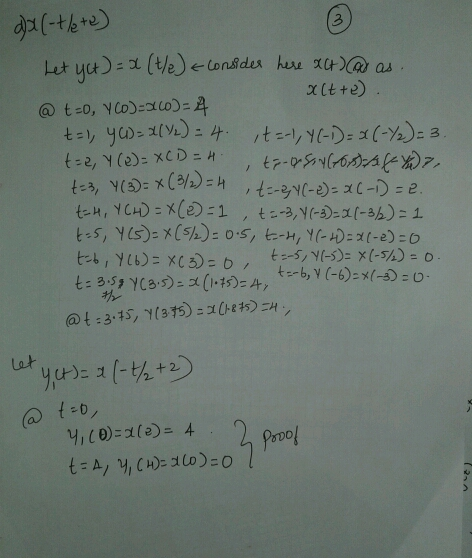
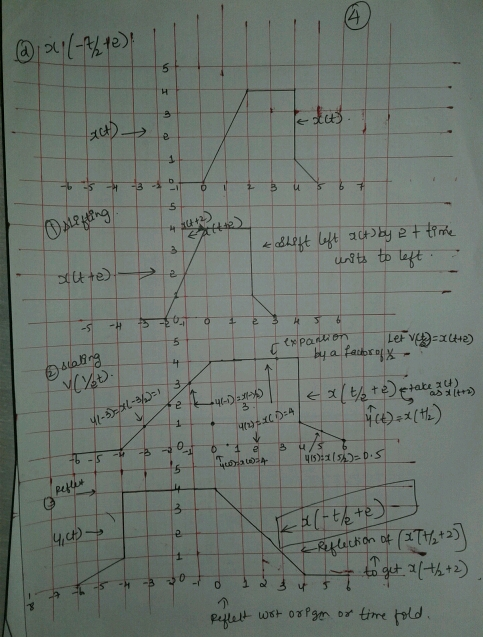
MATLAB Q1 A signal x(t) is shown in the following figure: X) 3 -2 1 01...
 MATLAB
Q1 A signal x(t) is shown in the following figure: X) 3 -2 1 01 2 3 sketch x( t+2).
MATLAB
Q1 A signal x(t) is shown in the following figure: X) 3 -2 1 01 2 3 sketch x( t+2).
4. Find the Nyquist rate for the following signals. For each case sketch the magnitude spectrum...
 4. Find the Nyquist rate for the following signals. For each case sketch the magnitude spectrum of the sampled signal if the sampling rate is 25% higher than the Nyquist rate. a.) ft)sinc E 2T 10 b.) h)=sinc 2T For all the following, use ft) given in part a.) c.) glt)= f(l-7) d.) c(t)- f)cos() 1 e.) x(t)= fit)+ _ sinc (t
4. Find the Nyquist rate for the following signals. For each case sketch the magnitude spectrum of the...
4. Find the Nyquist rate for the following signals. For each case sketch the magnitude spectrum of the sampled signal if the sampling rate is 25% higher than the Nyquist rate. a.) ft)sinc E 2T 10 b.) h)=sinc 2T For all the following, use ft) given in part a.) c.) glt)= f(l-7) d.) c(t)- f)cos() 1 e.) x(t)= fit)+ _ sinc (t
4. Find the Nyquist rate for the following signals. For each case sketch the magnitude spectrum of the...
3. Sketch stuff (by hand or by computer) 3.1 Systems signals The signal x()-sin^t), for 0stsl;...
 3. Sketch stuff (by hand or by computer) 3.1 Systems signals The signal x()-sin^t), for 0stsl; is applied to a circuit with an impulse response given by h(t)-2, for Osts1. Sketch these signals and the output of the circuit If the input signal is now set to x()-6(t-3), sketch the input and output signals. (3.2)
 I need a Matlab code example plz
1. Suppose x(t) -3u(t+3) - u(t)+ 3H(t-3) - 5H(t-6) a. Sketch x(t). b. For the signal x(t) given, determine and sketch the following signals: ,g(t) x(t-6) g2(t) - x(3t-6) ii. s(t) x(3t-6) +2 c. Create a MATLAB script that uses a function to express x(t), and plots x(t) in the time interval- 5 < t < 8s, using a time increment of At= 0.01s. Next, use the function to graph each of the...
I need a Matlab code example plz
1. Suppose x(t) -3u(t+3) - u(t)+ 3H(t-3) - 5H(t-6) a. Sketch x(t). b. For the signal x(t) given, determine and sketch the following signals: ,g(t) x(t-6) g2(t) - x(3t-6) ii. s(t) x(3t-6) +2 c. Create a MATLAB script that uses a function to express x(t), and plots x(t) in the time interval- 5 < t < 8s, using a time increment of At= 0.01s. Next, use the function to graph each of the...
 (a) Determine the Fourier transform of x(t) 26(t-1)-6(t-3) (b) Compute the convolution sum of the following signals, (6%) [696] (c) The Fourier transform of a continuous-time signal a(t) is given below. Determine the [696] total energy of (t) 4 sin w (d) Determine the DC value and the average power of the following periodic signal. (6%) 0.5 0.5 (e) Determine the Nyquist rate for the following signal. (6%) x(t) = [1-0.78 cos(50nt + π/4)]2. (f) Sketch the frequency spectrum of...
 2. For the signal shown in figure, draw the following signals x(t) 2 1 -1 0 1 2 a. x(t-5) b. x(2t+1) C. x(6-t) d. x(-t-2) e. [x(t)+x(-t)Ju(t) 3. Given x[n]=(6-1)[[n] -u[n-6]], draw the following signals a. X[n+3] b. X[3n+1] c. X[6-n) d. x 4. Draw the following signals a. X(t)=u(sin st) b. X(t)=u(t+1)-2u(t)+u(t-1) c. X(t)=r(++4)-r(1+2)+u(t)-3r(1-4)+3r(1-5) d. x(t)=2u(t)-u(1-2)+1(1-3)-2r(1-4)+2r(1-5)
 Sketch the signals with the figure given below.
i. x(t+1)y(t-2)
ii. x(4-t)y(2t)
X(t) 1 2 3 t -1 y(t) -2 -1 1 2 -1
Sketch the signals with the figure given below.
i. x(t+1)y(t-2)
ii. x(4-t)y(2t)
X(t) 1 2 3 t -1 y(t) -2 -1 1 2 -1
 1) (Fourier Transforms each of the following signals (a - c), sketch the signal x(t), and find its Fourier Transform X(f) using the defining integral (rather than "known" transforms and properties) (a)x(t) rectt 0.5) from Definition)- For (c) r(t) = te-2, 11(1) (b) x(t)-2t rect(t)
1) (Fourier Transforms each of the following signals (a - c), sketch the signal x(t), and find its Fourier Transform X(f) using the defining integral (rather than "known" transforms and properties) (a)x(t) rectt 0.5) from...
1) (Fourier Transforms each of the following signals (a - c), sketch the signal x(t), and find its Fourier Transform X(f) using the defining integral (rather than "known" transforms and properties) (a)x(t) rectt 0.5) from Definition)- For (c) r(t) = te-2, 11(1) (b) x(t)-2t rect(t)
1) (Fourier Transforms each of the following signals (a - c), sketch the signal x(t), and find its Fourier Transform X(f) using the defining integral (rather than "known" transforms and properties) (a)x(t) rectt 0.5) from...
 For the signal g(t) shown in the following figure: a. Sketch the signals: 4. i) g(20) ii) g(t-12) iii) g(6t) iv) g(3-t) find the energies of all the signals in part (a) b. g(t) 0.5 0 12 15 24
 Kindly provide calculation and show each step. Thanks
(a) Given the signal x(t) in Figure 2, sketch the signal for: xit) 12 10 - 2- 0.2 0.4 0.6 2 14 1.6 1.8 2 0.8 Figure 2 i. x(t+2) [4 Marks] ii. x(t/3) [4 Marks] iii. x(2t) [4 Marks] iv. -X(t) [4 Marks] (b) Given the signal x(t) in Figure 3, sketch the signal for x-(2t-2): xit 25 2 1.5 1 0.5 -0.5 0.5 1 1.5 2 2.5 3.5 Figure 3...
Kindly provide calculation and show each step. Thanks
(a) Given the signal x(t) in Figure 2, sketch the signal for: xit) 12 10 - 2- 0.2 0.4 0.6 2 14 1.6 1.8 2 0.8 Figure 2 i. x(t+2) [4 Marks] ii. x(t/3) [4 Marks] iii. x(2t) [4 Marks] iv. -X(t) [4 Marks] (b) Given the signal x(t) in Figure 3, sketch the signal for x-(2t-2): xit 25 2 1.5 1 0.5 -0.5 0.5 1 1.5 2 2.5 3.5 Figure 3...
 MATLAB
Q1 A signal x(t) is shown in the following figure: X) 3 -2 1 01 2 3 sketch x( t+2).
MATLAB
Q1 A signal x(t) is shown in the following figure: X) 3 -2 1 01 2 3 sketch x( t+2).
 4. Find the Nyquist rate for the following signals. For each case sketch the magnitude spectrum of the sampled signal if the sampling rate is 25% higher than the Nyquist rate. a.) ft)sinc E 2T 10 b.) h)=sinc 2T For all the following, use ft) given in part a.) c.) glt)= f(l-7) d.) c(t)- f)cos() 1 e.) x(t)= fit)+ _ sinc (t
4. Find the Nyquist rate for the following signals. For each case sketch the magnitude spectrum of the...
4. Find the Nyquist rate for the following signals. For each case sketch the magnitude spectrum of the sampled signal if the sampling rate is 25% higher than the Nyquist rate. a.) ft)sinc E 2T 10 b.) h)=sinc 2T For all the following, use ft) given in part a.) c.) glt)= f(l-7) d.) c(t)- f)cos() 1 e.) x(t)= fit)+ _ sinc (t
4. Find the Nyquist rate for the following signals. For each case sketch the magnitude spectrum of the...
 3. Sketch stuff (by hand or by computer) 3.1 Systems signals The signal x()-sin^t), for 0stsl; is applied to a circuit with an impulse response given by h(t)-2, for Osts1. Sketch these signals and the output of the circuit If the input signal is now set to x()-6(t-3), sketch the input and output signals. (3.2)
Most questions answered within 3 hours.
-
A 2.5 kg block rests on a 30 ∘ slope and is attached by a string...
asked 4 minutes ago -
In C++ code language please:
1. Created a linked list
2. Insert 5 values: 1, 10,...
asked 7 minutes ago -
By analogy with automobiles, defects in cancer critical genes
have been likened to broken brakes and...
asked 28 minutes ago -
Supposing Delta is an example of a very large US commercial
airline, how does the magnitude...
asked 32 minutes ago -
The total amount of shares that a corporation's charter allows
it to issue is:
Issued.
Authorized....
asked 33 minutes ago -
Which of the following statements is false? Explain what is
wrong with the statement.
a. A...
asked 40 minutes ago -
Vincent Simmons appeals from the trial court's order awarding to
his wife, Dorothy Simmons, a one-half...
asked 42 minutes ago -
A group of researchers has developed a method that they
hypothesize will improve the reading ability...
asked 42 minutes ago -
When 1 Liter volumes of the below solutions are mixed, which
will result in the precipitation...
asked 45 minutes ago -
A truck moving at 45 m/s passes a police car moving at 36 m/s in
the...
asked 44 minutes ago -
By using specific examples, explain how multinational firms
balance (or not as the case may be)...
asked 46 minutes ago -
Given X ~ Exp(1/8), we survey 100 at a time and are interested
in the distribution...
asked 1 hour ago