
I need a Matlab code example plz
Homework Answers


Add Answer to:
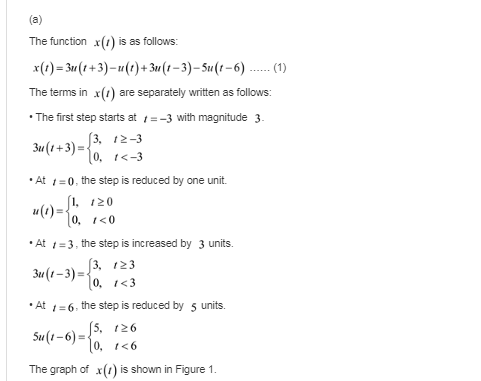
1. Suppose x(t) -3u(t+3) - u(t)+ 3H(t-3) - 5H(t-6) a. Sketch x(t). b. For the signal x(t) given, ...
A periodic signal, x(t) is shown below. A = 10, T-4 sec. -T Write a MATLAB script to plot the sig...
 A periodic signal, x(t) is shown below. A = 10, T-4 sec. -T Write a MATLAB script to plot the signal, using enough points to get a smooth curve. Compute the Fourier series coefficients for the signal (if you can find them in the text, that is ok). Plot the single-sided or double-sided spectra for each signal. Include enough frequencies in the plots to adequately represent the frequency content of the signals. Plot partial sums of the Fourier series for...
Signal x(t) is given in the figure below. Using this information, sketch the following signals (MATLAB...
 Signal x(t) is given in the figure below. Using this information, sketch the following signals (MATLAB is not required) 5 4 1 0 2345 a) x(t 3) b) x(t +3) c) x(2t +3)
3. Sketch solutions (a) The signal x(t)-sint), for 0sts1; is applied to a circuit with an...
 3. Sketch solutions (a) The signal x(t)-sint), for 0sts1; is applied to a circuit with an impulse response given by ht)-2, for 0sts1. Sketch these signals and the output of the circuit (b)If the input signal is now set to x(t)-6(t-3), sketch the input and output signals.
Matlab help 1) Given the functions x1()= tu()-tuft-1) and X2(t)=10e-5,11(), do the following: 1. Plotx,(t) and x2(0) using MATLAB 2. Use MATLAB to find and plot x(0=x:@*.x2(t), where * denotes co...
 Matlab help
1) Given the functions x1()= tu()-tuft-1) and X2(t)=10e-5,11(), do the following: 1. Plotx,(t) and x2(0) using MATLAB 2. Use MATLAB to find and plot x(0=x:@*.x2(t), where * denotes convolution. 3. Find x(t)=x;()*X2(1) by hand using Laplace transforms. 4. Plot the result of part 3 in MATLAB and compare it to that found in part 2. 2) Given the transfer function shown below, do the following: 1. Find the system's impulse response and plot it using MATLAB 2. Repeat...
Matlab help
1) Given the functions x1()= tu()-tuft-1) and X2(t)=10e-5,11(), do the following: 1. Plotx,(t) and x2(0) using MATLAB 2. Use MATLAB to find and plot x(0=x:@*.x2(t), where * denotes convolution. 3. Find x(t)=x;()*X2(1) by hand using Laplace transforms. 4. Plot the result of part 3 in MATLAB and compare it to that found in part 2. 2) Given the transfer function shown below, do the following: 1. Find the system's impulse response and plot it using MATLAB 2. Repeat...
Please answer in MATLAB, thank you! 2. Calculate the energy of time domain signal x (t) and z (t) for the range of 0SIS...
 Please answer in MATLAB, thank you!
2. Calculate the energy of time domain signal x (t) and z (t) for the range of 0SIS2.5 Also calculate the energy of these signals in frequency domain using Parseval's theorem. Plot Energy (X) and Energy (Z) as a function of frequency f in a 2xl subplot (Energy vs frequency plot is know as energy spectrum of a signal).
2. Calculate the energy of time domain signal x (t) and z (t) for the...
Please answer in MATLAB, thank you!
2. Calculate the energy of time domain signal x (t) and z (t) for the range of 0SIS2.5 Also calculate the energy of these signals in frequency domain using Parseval's theorem. Plot Energy (X) and Energy (Z) as a function of frequency f in a 2xl subplot (Energy vs frequency plot is know as energy spectrum of a signal).
2. Calculate the energy of time domain signal x (t) and z (t) for the...
g1(t) = cos(40*pi*t); g2(t) = cos(60*pi*t); g3(t) = cos(160*pi*t); a. Using a sampling period of 1.0...
 g1(t) = cos(40*pi*t); g2(t) =
cos(60*pi*t); g3(t) = cos(160*pi*t); a. Using a sampling period of
1.0 ms to simulate the continuous-time signal, in Matlab generate
and plot the analog signal described in Problem 2 Part (a) over the
interval 0 ? t ? 300ms, and overlay the plotted signal with the
equivalents of its sampled versions. Denote the latter with
different symbols (e.g., open circles, diamonds, etc). b. Repeat
for g2 (t) and g3 (t) described in Problem 2 on...
g1(t) = cos(40*pi*t); g2(t) =
cos(60*pi*t); g3(t) = cos(160*pi*t); a. Using a sampling period of
1.0 ms to simulate the continuous-time signal, in Matlab generate
and plot the analog signal described in Problem 2 Part (a) over the
interval 0 ? t ? 300ms, and overlay the plotted signal with the
equivalents of its sampled versions. Denote the latter with
different symbols (e.g., open circles, diamonds, etc). b. Repeat
for g2 (t) and g3 (t) described in Problem 2 on...
#4) The following signal x(t) is given (graph). Sketch (a) x(-t/3) (b) -2x(-3t+3) - 2 Please...
 #4) The following signal x(t) is given (graph). Sketch (a) x(-t/3) (b) -2x(-3t+3) - 2 Please help me and explain the steps? I'm really trying to understand this. Thank you 3 F-1
3. Sketch stuff (by hand or by computer) 3.1 Systems signals The signal x()-sin^t), for 0stsl;...
 3. Sketch stuff (by hand or by computer) 3.1 Systems signals The signal x()-sin^t), for 0stsl; is applied to a circuit with an impulse response given by h(t)-2, for Osts1. Sketch these signals and the output of the circuit If the input signal is now set to x()-6(t-3), sketch the input and output signals. (3.2)
Matlab help 1) Given the functions x1()= tu()-tuft-1) and X2(t)=10e-5,11(), do the following: 1. Plotx,(t) and...
 Matlab help
1) Given the functions x1()= tu()-tuft-1) and X2(t)=10e-5,11(), do the following: 1. Plotx,(t) and x2(0) using MATLAB 2. Use MATLAB to find and plot x(0=x:@*.x2(t), where * denotes convolution. 3. Find x(t)=x;()*X2(1) by hand using Laplace transforms. 4. Plot the result of part 3 in MATLAB and compare it to that found in part 2. 2) Given the transfer function shown below, do the following: 1. Find the system's impulse response and plot it using MATLAB 2. Repeat...
Matlab help
1) Given the functions x1()= tu()-tuft-1) and X2(t)=10e-5,11(), do the following: 1. Plotx,(t) and x2(0) using MATLAB 2. Use MATLAB to find and plot x(0=x:@*.x2(t), where * denotes convolution. 3. Find x(t)=x;()*X2(1) by hand using Laplace transforms. 4. Plot the result of part 3 in MATLAB and compare it to that found in part 2. 2) Given the transfer function shown below, do the following: 1. Find the system's impulse response and plot it using MATLAB 2. Repeat...
(a) Determine the Fourier transform of x(t) 26(t-1)-6(t-3) (b) Compute the convolution sum of the following signals, (6%) [696] (c) The Fourier transform of a continuous-time signal a(t) is given bel...
 (a) Determine the Fourier transform of x(t) 26(t-1)-6(t-3) (b) Compute the convolution sum of the following signals, (6%) [696] (c) The Fourier transform of a continuous-time signal a(t) is given below. Determine the [696] total energy of (t) 4 sin w (d) Determine the DC value and the average power of the following periodic signal. (6%) 0.5 0.5 (e) Determine the Nyquist rate for the following signal. (6%) x(t) = [1-0.78 cos(50nt + π/4)]2. (f) Sketch the frequency spectrum of...
 A periodic signal, x(t) is shown below. A = 10, T-4 sec. -T Write a MATLAB script to plot the signal, using enough points to get a smooth curve. Compute the Fourier series coefficients for the signal (if you can find them in the text, that is ok). Plot the single-sided or double-sided spectra for each signal. Include enough frequencies in the plots to adequately represent the frequency content of the signals. Plot partial sums of the Fourier series for...
 Signal x(t) is given in the figure below. Using this information, sketch the following signals (MATLAB is not required) 5 4 1 0 2345 a) x(t 3) b) x(t +3) c) x(2t +3)
 3. Sketch solutions (a) The signal x(t)-sint), for 0sts1; is applied to a circuit with an impulse response given by ht)-2, for 0sts1. Sketch these signals and the output of the circuit (b)If the input signal is now set to x(t)-6(t-3), sketch the input and output signals.
 Matlab help
1) Given the functions x1()= tu()-tuft-1) and X2(t)=10e-5,11(), do the following: 1. Plotx,(t) and x2(0) using MATLAB 2. Use MATLAB to find and plot x(0=x:@*.x2(t), where * denotes convolution. 3. Find x(t)=x;()*X2(1) by hand using Laplace transforms. 4. Plot the result of part 3 in MATLAB and compare it to that found in part 2. 2) Given the transfer function shown below, do the following: 1. Find the system's impulse response and plot it using MATLAB 2. Repeat...
Matlab help
1) Given the functions x1()= tu()-tuft-1) and X2(t)=10e-5,11(), do the following: 1. Plotx,(t) and x2(0) using MATLAB 2. Use MATLAB to find and plot x(0=x:@*.x2(t), where * denotes convolution. 3. Find x(t)=x;()*X2(1) by hand using Laplace transforms. 4. Plot the result of part 3 in MATLAB and compare it to that found in part 2. 2) Given the transfer function shown below, do the following: 1. Find the system's impulse response and plot it using MATLAB 2. Repeat...
 Please answer in MATLAB, thank you!
2. Calculate the energy of time domain signal x (t) and z (t) for the range of 0SIS2.5 Also calculate the energy of these signals in frequency domain using Parseval's theorem. Plot Energy (X) and Energy (Z) as a function of frequency f in a 2xl subplot (Energy vs frequency plot is know as energy spectrum of a signal).
2. Calculate the energy of time domain signal x (t) and z (t) for the...
Please answer in MATLAB, thank you!
2. Calculate the energy of time domain signal x (t) and z (t) for the range of 0SIS2.5 Also calculate the energy of these signals in frequency domain using Parseval's theorem. Plot Energy (X) and Energy (Z) as a function of frequency f in a 2xl subplot (Energy vs frequency plot is know as energy spectrum of a signal).
2. Calculate the energy of time domain signal x (t) and z (t) for the...
 g1(t) = cos(40*pi*t); g2(t) =
cos(60*pi*t); g3(t) = cos(160*pi*t); a. Using a sampling period of
1.0 ms to simulate the continuous-time signal, in Matlab generate
and plot the analog signal described in Problem 2 Part (a) over the
interval 0 ? t ? 300ms, and overlay the plotted signal with the
equivalents of its sampled versions. Denote the latter with
different symbols (e.g., open circles, diamonds, etc). b. Repeat
for g2 (t) and g3 (t) described in Problem 2 on...
g1(t) = cos(40*pi*t); g2(t) =
cos(60*pi*t); g3(t) = cos(160*pi*t); a. Using a sampling period of
1.0 ms to simulate the continuous-time signal, in Matlab generate
and plot the analog signal described in Problem 2 Part (a) over the
interval 0 ? t ? 300ms, and overlay the plotted signal with the
equivalents of its sampled versions. Denote the latter with
different symbols (e.g., open circles, diamonds, etc). b. Repeat
for g2 (t) and g3 (t) described in Problem 2 on...
 #4) The following signal x(t) is given (graph). Sketch (a) x(-t/3) (b) -2x(-3t+3) - 2 Please help me and explain the steps? I'm really trying to understand this. Thank you 3 F-1
 3. Sketch stuff (by hand or by computer) 3.1 Systems signals The signal x()-sin^t), for 0stsl; is applied to a circuit with an impulse response given by h(t)-2, for Osts1. Sketch these signals and the output of the circuit If the input signal is now set to x()-6(t-3), sketch the input and output signals. (3.2)
 Matlab help
1) Given the functions x1()= tu()-tuft-1) and X2(t)=10e-5,11(), do the following: 1. Plotx,(t) and x2(0) using MATLAB 2. Use MATLAB to find and plot x(0=x:@*.x2(t), where * denotes convolution. 3. Find x(t)=x;()*X2(1) by hand using Laplace transforms. 4. Plot the result of part 3 in MATLAB and compare it to that found in part 2. 2) Given the transfer function shown below, do the following: 1. Find the system's impulse response and plot it using MATLAB 2. Repeat...
Matlab help
1) Given the functions x1()= tu()-tuft-1) and X2(t)=10e-5,11(), do the following: 1. Plotx,(t) and x2(0) using MATLAB 2. Use MATLAB to find and plot x(0=x:@*.x2(t), where * denotes convolution. 3. Find x(t)=x;()*X2(1) by hand using Laplace transforms. 4. Plot the result of part 3 in MATLAB and compare it to that found in part 2. 2) Given the transfer function shown below, do the following: 1. Find the system's impulse response and plot it using MATLAB 2. Repeat...
 (a) Determine the Fourier transform of x(t) 26(t-1)-6(t-3) (b) Compute the convolution sum of the following signals, (6%) [696] (c) The Fourier transform of a continuous-time signal a(t) is given below. Determine the [696] total energy of (t) 4 sin w (d) Determine the DC value and the average power of the following periodic signal. (6%) 0.5 0.5 (e) Determine the Nyquist rate for the following signal. (6%) x(t) = [1-0.78 cos(50nt + π/4)]2. (f) Sketch the frequency spectrum of...
Most questions answered within 3 hours.
-
In winter a lake has a 0.35 m thick ice layer over 1.10 m of
water....
asked 29 minutes ago -
Assuming the following has been encrypted with a Vigenere cipher
below, use the method(s) and assumptions...
asked 54 minutes ago -
How would I use switch statements to write a program that will
take an input of...
asked 45 minutes ago -
Imagine a reaction in which methane gas combusts at a constant
pressure of 1 atm and...
asked 55 minutes ago -
Two parallel wires (each 12 m in length) are separated by a
distance of 0.065 m...
asked 53 minutes ago -
Suppose there were three masses at the corner of uniform
equilateral triangle. The masses are m1...
asked 55 minutes ago -
Situation: A building that is 618 m above the ground floor. How
many times would a...
asked 59 minutes ago -
help me and discuss one successful and one
unsuccessful international company/busines in Indonesia.whyit
succeed and why...
asked 1 hour ago -
I- Choose the best answer
Which of the following statements about the structure and
packaging of...
asked 1 hour ago -
1. A sample of 144 incoming freshman found that 45 of them
scored more than 550...
asked 1 hour ago -
Kc is 2.35 × 10¹⁸ at 25 °C for the formation of iron(III)
oxalate complex ion....
asked 1 hour ago -
Team Values – Discuss as a team what values are important.
Develop a statement or itemised...
asked 1 hour ago