
Homework Answers
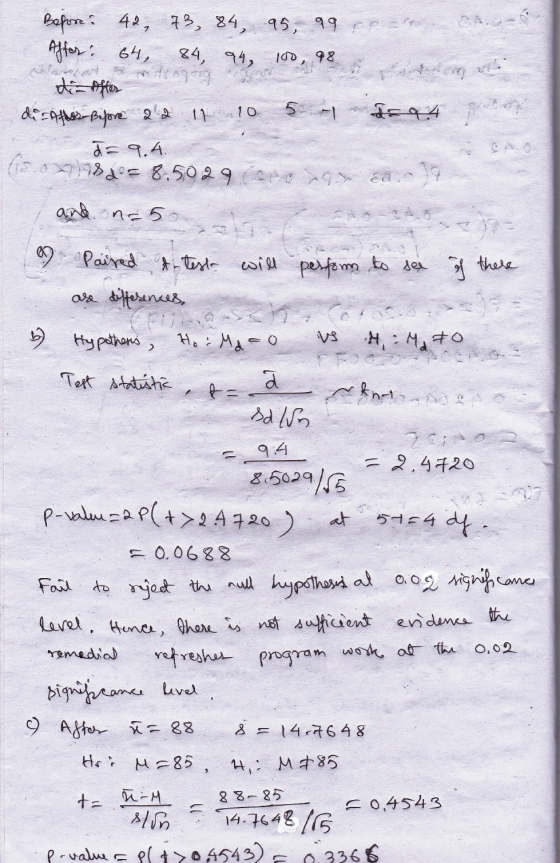
Comment: The p-value is 0.3366 and more than 0.02 level of significance. So, fail to reject the null hypothesis and can not accept the claim that the mean scores after a student takes the remedial class to be greater than 85.
Add Answer to:
QUESTION 1: In Minitab, Answer the following questions for the set of data below. It represents...
8. The following data are scores from a Physics final administered to 34 students. 81 76...
 8. The following data are scores from a Physics final administered to 34 students. 81 76 93 99 47 67 69 72 83 88 56 62 91 94 98 63 77 84 98 75 79 67 73 65 89 86 91 85 97 73 56 92 88 83 Use the Chart below to construct a Frequency Distribution with 5 classes (15 pts) Class Tally (This column is optional.) Frequency
I need answer on number 7 please 5. Students in a statistics class took their first...
I need answer on number 7 please 5. Students in a statistics class took their first test. The following table lists the scores they earned. 67 67 76 47 85 70 87 76 67 72 84 98 84 64 65 82 81 81 88 74 87 83 Complete the following frequency distribution table using 6 classes: 40-49, 50-59, 60-69, 70-79, 80-89, and 90-99. Scores Tally Frequency Relative Frequency Cumulative Relative Frequency 40 - 49 50 - 59 60 - 69...
please provide detailed answer thank you! Below are matched pair data consisting of customer service scores...
 please provide detailed answer thank you!
Below are matched pair data consisting of customer service scores for a sample of 10 employees before and after they watched an instructional video on their company's mission statement. At a 0.1 significance level, use the sign test to test the claim that viewing the instructional video affects the employees' customer service scores. Before After 52 57 46 47 46 48 60 58 36 38 38 41 56 58 38 41 61 64 38...
please provide detailed answer thank you!
Below are matched pair data consisting of customer service scores for a sample of 10 employees before and after they watched an instructional video on their company's mission statement. At a 0.1 significance level, use the sign test to test the claim that viewing the instructional video affects the employees' customer service scores. Before After 52 57 46 47 46 48 60 58 36 38 38 41 56 58 38 41 61 64 38...
A data set of test scores consisted of the following: 36 42 55 60 63 75...
 A data set of test scores consisted of the following: 36 42 55 60 63 75 77 78 79 80 83 83 84 84 85 85 86 87 91 91 92 94 99 On a stem-and-leaf display, the values of the tens digits (3-9) are: the trailing digits the leaves the less significant digits the stems
please provide detailed answer, thank you! The scores of 8 students on the midterm exam and...
 please provide detailed answer, thank you!
The scores of 8 students on the midterm exam and final exam were as follows. Final Student Anderson Bailey Cruz DeSana Erickson Francis Gray Harris Midterm 100 98 96 96 87 80 78 73 85 94 93 71 99 76 88 95 Find the value of the (Spearman's) rank correlation coefficient test statistic that would be used to test the claim of no correlation between midterm score and final exam score. Round your answer...
please provide detailed answer, thank you!
The scores of 8 students on the midterm exam and final exam were as follows. Final Student Anderson Bailey Cruz DeSana Erickson Francis Gray Harris Midterm 100 98 96 96 87 80 78 73 85 94 93 71 99 76 88 95 Find the value of the (Spearman's) rank correlation coefficient test statistic that would be used to test the claim of no correlation between midterm score and final exam score. Round your answer...
Consider the below matrixA, which you can copy and paste directly into Matlab.
Problem #1: Consider the below matrix A, which you can copy and paste directly into Matlab. The matrix contains 3 columns. The first column consists of Test #1 marks, the second column is Test # 2 marks, and the third column is final exam marks for a large linear algebra course. Each row represents a particular student.A = [36 45 75 81 59 73 77 73 73 65 72 78 65 55 83 73 57 78 84 31 60 83...
siness test before and after the course. The results are given below. Student Exam Score Before...
siness test before and after the course. The results are given below. Student Exam Score Before the Course Exam Score After the Course 1 630 770 2 690 770 3 910 1,000 4 750 710 5 450 550 6 840 860 7 820 770 8 630 610 9 580 585 (a) Use an appropriate hypothesis test, at 0.01 level of significance, to determine whether there is evidence of a difference between before and after scores of the students. (b) What...
PLEASE SHOW ME HOW TO DO THIS.... For the Excel Data Set please find and report...
 PLEASE SHOW ME HOW TO DO THIS....
For
the Excel Data Set please find and report for Test 1 and Test 2 the
Mean, SD, and the tolerance levels for both for which there would
be any outliers (i.e., the value for which a score must be less
than to be consider an outlier and the value for which a number
must greater than to be considered an outlier.
See picture
Performance Data Group 1 1 1 1 Test 2...
PLEASE SHOW ME HOW TO DO THIS....
For
the Excel Data Set please find and report for Test 1 and Test 2 the
Mean, SD, and the tolerance levels for both for which there would
be any outliers (i.e., the value for which a score must be less
than to be consider an outlier and the value for which a number
must greater than to be considered an outlier.
See picture
Performance Data Group 1 1 1 1 Test 2...
Question 1 15 pts Test scores for a class of 40 students are listed below: 25...
 Question 1 15 pts Test scores for a class of 40 students are listed below: 25 35 43 44 47 48 54 55 56 57 59 62 63 65 66 68 69 69 71 72 72 73 74 76 77 77 78 79 80 81 81 82 83 85 89 92 93 94 97 98 a) The mean of the sample data is b) The median of the sample data is c) The standard deviation of the sample data is...
Use the accompanying data set on the pulse rates (in beats per minute) of males to...
Use the accompanying data set on the pulse rates (in beats per minute) of males to complete parts (a) and (b) below. LOADING... Click the icon to view the pulse rates of males. a. Find the mean and standard deviation, and verify that the pulse rates have a distribution that is roughly normal. The mean of the pulse rates is 71.871.8 beats per minute. (Round to one decimal place as needed.) The standard deviation of the pulse rates is 12.212.2...
 8. The following data are scores from a Physics final administered to 34 students. 81 76 93 99 47 67 69 72 83 88 56 62 91 94 98 63 77 84 98 75 79 67 73 65 89 86 91 85 97 73 56 92 88 83 Use the Chart below to construct a Frequency Distribution with 5 classes (15 pts) Class Tally (This column is optional.) Frequency
 please provide detailed answer thank you!
Below are matched pair data consisting of customer service scores for a sample of 10 employees before and after they watched an instructional video on their company's mission statement. At a 0.1 significance level, use the sign test to test the claim that viewing the instructional video affects the employees' customer service scores. Before After 52 57 46 47 46 48 60 58 36 38 38 41 56 58 38 41 61 64 38...
please provide detailed answer thank you!
Below are matched pair data consisting of customer service scores for a sample of 10 employees before and after they watched an instructional video on their company's mission statement. At a 0.1 significance level, use the sign test to test the claim that viewing the instructional video affects the employees' customer service scores. Before After 52 57 46 47 46 48 60 58 36 38 38 41 56 58 38 41 61 64 38...
 A data set of test scores consisted of the following: 36 42 55 60 63 75 77 78 79 80 83 83 84 84 85 85 86 87 91 91 92 94 99 On a stem-and-leaf display, the values of the tens digits (3-9) are: the trailing digits the leaves the less significant digits the stems
 please provide detailed answer, thank you!
The scores of 8 students on the midterm exam and final exam were as follows. Final Student Anderson Bailey Cruz DeSana Erickson Francis Gray Harris Midterm 100 98 96 96 87 80 78 73 85 94 93 71 99 76 88 95 Find the value of the (Spearman's) rank correlation coefficient test statistic that would be used to test the claim of no correlation between midterm score and final exam score. Round your answer...
please provide detailed answer, thank you!
The scores of 8 students on the midterm exam and final exam were as follows. Final Student Anderson Bailey Cruz DeSana Erickson Francis Gray Harris Midterm 100 98 96 96 87 80 78 73 85 94 93 71 99 76 88 95 Find the value of the (Spearman's) rank correlation coefficient test statistic that would be used to test the claim of no correlation between midterm score and final exam score. Round your answer...
 PLEASE SHOW ME HOW TO DO THIS....
For
the Excel Data Set please find and report for Test 1 and Test 2 the
Mean, SD, and the tolerance levels for both for which there would
be any outliers (i.e., the value for which a score must be less
than to be consider an outlier and the value for which a number
must greater than to be considered an outlier.
See picture
Performance Data Group 1 1 1 1 Test 2...
PLEASE SHOW ME HOW TO DO THIS....
For
the Excel Data Set please find and report for Test 1 and Test 2 the
Mean, SD, and the tolerance levels for both for which there would
be any outliers (i.e., the value for which a score must be less
than to be consider an outlier and the value for which a number
must greater than to be considered an outlier.
See picture
Performance Data Group 1 1 1 1 Test 2...
 Question 1 15 pts Test scores for a class of 40 students are listed below: 25 35 43 44 47 48 54 55 56 57 59 62 63 65 66 68 69 69 71 72 72 73 74 76 77 77 78 79 80 81 81 82 83 85 89 92 93 94 97 98 a) The mean of the sample data is b) The median of the sample data is c) The standard deviation of the sample data is...
Most questions answered within 3 hours.
-
10. Complete the table below
only using hexadecimal numbers:
AL CODE
EBX
EAX
[EAX]
mov eax,...
asked 9 minutes ago -
trust is best established through the combination of ------and
------- .
1. magnanimity and justice
2....
asked 24 minutes ago -
Blood pressure is normally taken on the upper arm at the level
of the heart. Suppose,...
asked 23 minutes ago -
Suppose that the satellite around the earth has an orbit that is
24 KM larger in...
asked 26 minutes ago -
Calculate the [OH (aq)] in limes which have a [H3O*(aq)] of 1.3 x
10 mol/L
asked 24 minutes ago -
A nozzle with a radius of 0.250 cm is attached to a garden hose
with a...
asked 35 minutes ago -
PLEASE do not use any loops for the program; only recursion is
allowed
4. Write a...
asked 44 minutes ago -
Please help me with me. I did the first part to write the operations but in...
asked 41 minutes ago -
Use Cryptool to find the Cryptographic SHA-1 hash value of the
string "abc". The calculator is...
asked 46 minutes ago -
You are attempting to calculate a firm’s free cash flow to
equity. You know the following...
asked 1 hour ago -
the following reaction occurs in a balloon containing
N2O2 gas
N2O4(g)=2NO2(g)
will the volume of the...
asked 2 hours ago -
answer the questions throughout this program
public class Day implements Comparable {
Private Boolean atWork;...
asked 2 hours ago