
Homework Answers

Add Answer to:
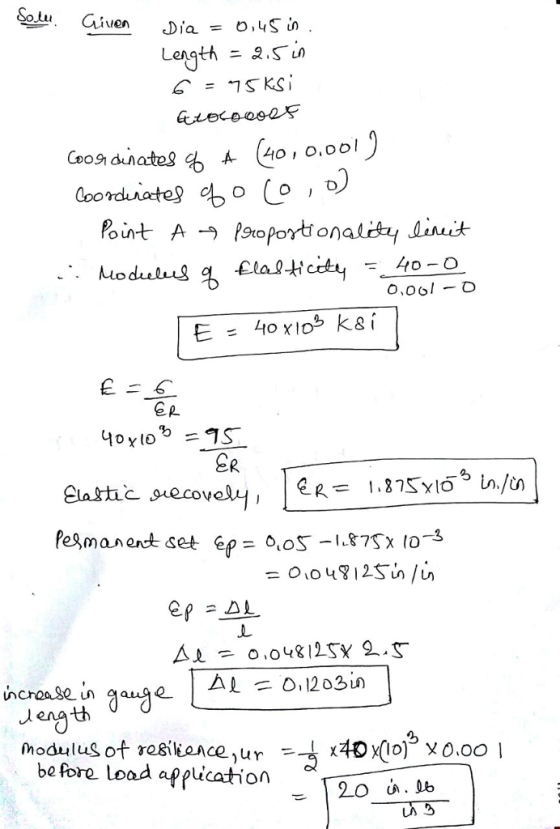
Question #3: The stress-strain diagram for a steel alloy having an original diameter of 0.45 in....
The stress–strain diagram for a steel alloy having an original diameter of 0.5 in. and a...
 The stress–strain diagram for a steel alloy having an original
diameter of 0.5 in. and a gauge length of 2 in. is given in the
figure. If the specimen is loaded until it is stressed to 90 ksi,
determine the approximate amount of elastic recovery and the
increase in the gauge length after it is unloaded. Determine also
approximately the modulus of resilience and the modulus of
toughness for the material.
in. /in.) 0 0 - 0.05 0.10 0.15 0.20...
The stress–strain diagram for a steel alloy having an original
diameter of 0.5 in. and a gauge length of 2 in. is given in the
figure. If the specimen is loaded until it is stressed to 90 ksi,
determine the approximate amount of elastic recovery and the
increase in the gauge length after it is unloaded. Determine also
approximately the modulus of resilience and the modulus of
toughness for the material.
in. /in.) 0 0 - 0.05 0.10 0.15 0.20...
Strength of material The stress-strain diagram for an aluminum alloy specimen having an original diameter of...
 Strength of material
The stress-strain diagram for an aluminum alloy specimen having an original diameter of 0.5 in. and a gage length of 2 in, is shown in the figure below. σ (ksi) 70 60 50 40 30 20 10 0 e (in./in.) 0 0.02 0.04 0.06 0.08 0.10 0.12 0.14 0.16 0.18 0.2 0 00025 0.0050.0075 0.01 0.0125001500175 0.02 00255 0.025 Tap image to zoom Part A Determine the modulus of resilience. Express your answer to three significant figures....
Strength of material
The stress-strain diagram for an aluminum alloy specimen having an original diameter of 0.5 in. and a gage length of 2 in, is shown in the figure below. σ (ksi) 70 60 50 40 30 20 10 0 e (in./in.) 0 0.02 0.04 0.06 0.08 0.10 0.12 0.14 0.16 0.18 0.2 0 00025 0.0050.0075 0.01 0.0125001500175 0.02 00255 0.025 Tap image to zoom Part A Determine the modulus of resilience. Express your answer to three significant figures....
Problem 3.12 The stress-strain diagram for an aluminum alloy specimen having an original diameter of 0.5...
 Problem 3.12 The stress-strain diagram for an aluminum alloy specimen having an original diameter of 0.5 in and a gage length of 2 in is shown in the figure below. (Figure 1) Figure 1 of 1 > o (ksi) 70 60 50 40 30 20 10 0 0.02 0.04 0.06 0.08 0.10 0.12 0.14 0.16 0.18 0.2 € (in./in.) 0 0.0025 0.0050.0075 0.01 0.0125001500175 0.02 0.02550025 VAL nili Determine the modulus of resilience. Express your answer to three significant figures....
Problem 3 σ(ksi) The elastic portion of the tension stress-strain diagram for an aluminum alloy is...
 Problem 3 σ(ksi) The elastic portion of the tension stress-strain diagram for an aluminum alloy is shown in the figure. The specimen used for the test has a gage length of 2 in. and a diameter of 0.5 in. If the applied load is 10 kip, determine the new diameter of the specimen. The shear modulus is G-3.8(10') ksi. 60
3-5. The stress-strain diagram for a steel alloy having an original diameter of 12 mm and...
 3-5. The stress-strain diagram for a steel alloy having an original diameter of 12 mm and a gauge length of 50 mm is given in the figure. If the specimen is loaded until it is stressed to 500 MPa, determine the approximate amount of elastic recovery and the increase in the gauge length after it is unloaded. O (MPa) 600 - E(mm/mm) 0 0 0.04 0.08 0.12 0.16 0.20 0.24 0.28 0.0005 0.001 0.0015 0.002 0.0025 0.003 0.0035 Prob. 3-5
Problem No. 2 (Figure 2) (ksi) Figure 2. Upper scale Lower scale The stress-strain diagram of...
 Problem No. 2 (Figure 2) (ksi) Figure 2. Upper scale Lower scale The stress-strain diagram of a mild-steel specimen is shown in the figure. The specimen has a diameter of 0.50-inch and gage length of 2-inch. Determine the following: (a) yield strength (oy); (b) ultimate strength (out); (c) Young's modulus (E); (d) modulus of resilience; (e) if the specimen is loaded to 105 ksi and then unloaded completely, determine the permanent increase in the gage length € (in/in) 0 0.04...
Problem 1: A tension test was performed on a steel specimen having an original diameter of...
 Problem 1: A tension test was performed on a steel specimen having an original diameter of 0.50 in. and gage length of 2.00 in. The final diameter is de .38 in. The data is listed in the table. 1) Plot the stress-strain diagram on engineering paper, so you can calculate the area easily; 2) Determine approximately the modulus of elasticity; 3) Find the yield stress by 0.2% offset method; 4) Calculate approximately the modulus of resilience; 5) Determine approximately the...
 The stress–strain diagram for a steel alloy having an original
diameter of 0.5 in. and a gauge length of 2 in. is given in the
figure. If the specimen is loaded until it is stressed to 90 ksi,
determine the approximate amount of elastic recovery and the
increase in the gauge length after it is unloaded. Determine also
approximately the modulus of resilience and the modulus of
toughness for the material.
in. /in.) 0 0 - 0.05 0.10 0.15 0.20...
The stress–strain diagram for a steel alloy having an original
diameter of 0.5 in. and a gauge length of 2 in. is given in the
figure. If the specimen is loaded until it is stressed to 90 ksi,
determine the approximate amount of elastic recovery and the
increase in the gauge length after it is unloaded. Determine also
approximately the modulus of resilience and the modulus of
toughness for the material.
in. /in.) 0 0 - 0.05 0.10 0.15 0.20...
 Strength of material
The stress-strain diagram for an aluminum alloy specimen having an original diameter of 0.5 in. and a gage length of 2 in, is shown in the figure below. σ (ksi) 70 60 50 40 30 20 10 0 e (in./in.) 0 0.02 0.04 0.06 0.08 0.10 0.12 0.14 0.16 0.18 0.2 0 00025 0.0050.0075 0.01 0.0125001500175 0.02 00255 0.025 Tap image to zoom Part A Determine the modulus of resilience. Express your answer to three significant figures....
Strength of material
The stress-strain diagram for an aluminum alloy specimen having an original diameter of 0.5 in. and a gage length of 2 in, is shown in the figure below. σ (ksi) 70 60 50 40 30 20 10 0 e (in./in.) 0 0.02 0.04 0.06 0.08 0.10 0.12 0.14 0.16 0.18 0.2 0 00025 0.0050.0075 0.01 0.0125001500175 0.02 00255 0.025 Tap image to zoom Part A Determine the modulus of resilience. Express your answer to three significant figures....
 Problem 3.12 The stress-strain diagram for an aluminum alloy specimen having an original diameter of 0.5 in and a gage length of 2 in is shown in the figure below. (Figure 1) Figure 1 of 1 > o (ksi) 70 60 50 40 30 20 10 0 0.02 0.04 0.06 0.08 0.10 0.12 0.14 0.16 0.18 0.2 € (in./in.) 0 0.0025 0.0050.0075 0.01 0.0125001500175 0.02 0.02550025 VAL nili Determine the modulus of resilience. Express your answer to three significant figures....
 Problem 3 σ(ksi) The elastic portion of the tension stress-strain diagram for an aluminum alloy is shown in the figure. The specimen used for the test has a gage length of 2 in. and a diameter of 0.5 in. If the applied load is 10 kip, determine the new diameter of the specimen. The shear modulus is G-3.8(10') ksi. 60
 3-5. The stress-strain diagram for a steel alloy having an original diameter of 12 mm and a gauge length of 50 mm is given in the figure. If the specimen is loaded until it is stressed to 500 MPa, determine the approximate amount of elastic recovery and the increase in the gauge length after it is unloaded. O (MPa) 600 - E(mm/mm) 0 0 0.04 0.08 0.12 0.16 0.20 0.24 0.28 0.0005 0.001 0.0015 0.002 0.0025 0.003 0.0035 Prob. 3-5
 Problem No. 2 (Figure 2) (ksi) Figure 2. Upper scale Lower scale The stress-strain diagram of a mild-steel specimen is shown in the figure. The specimen has a diameter of 0.50-inch and gage length of 2-inch. Determine the following: (a) yield strength (oy); (b) ultimate strength (out); (c) Young's modulus (E); (d) modulus of resilience; (e) if the specimen is loaded to 105 ksi and then unloaded completely, determine the permanent increase in the gage length € (in/in) 0 0.04...
 Problem 1: A tension test was performed on a steel specimen having an original diameter of 0.50 in. and gage length of 2.00 in. The final diameter is de .38 in. The data is listed in the table. 1) Plot the stress-strain diagram on engineering paper, so you can calculate the area easily; 2) Determine approximately the modulus of elasticity; 3) Find the yield stress by 0.2% offset method; 4) Calculate approximately the modulus of resilience; 5) Determine approximately the...
Most questions answered within 3 hours.
-
Facebook Marketing benefit: How is this tool useful for
marketing purposes? Identify and explain at least...
asked 6 minutes ago -
What are the five considerations relevant to the
substantive fairness of a dismissal for permanent incapacity?...
asked 6 minutes ago -
Prince Electronics, a manufacturer of consumer electronic
goods, has five distribution centers in different regions of...
asked 8 minutes ago -
1.) For the following general reaction, rate = k[A]2 and k = 1.3
× 10−2 M−1...
asked 12 minutes ago -
In the Enron documentary(Netflix) What ethical issues did you
observe and who was responsible for them?
asked 12 minutes ago -
Many products fail, some of them spectacularly. Why do you
believe the failure rate for new...
asked 11 minutes ago -
An important news announcement is transmitted by radio waves to
people who are 65 km away,...
asked 31 minutes ago -
On June 30, 2021, Rosetta Granite purchased equipment for
$130,000. The estimated useful life of the...
asked 30 minutes ago -
. If you were the CEO of Agricole, would you pursue an
acquisition target in the...
asked 31 minutes ago -
(a) We define standard Gibbs energy change, G0 =
H0 – TS0, what is the relationship...
asked 31 minutes ago -
If the barometric pressure is 107.4 kPa, what is the pressure in
kPa of the gas...
asked 51 minutes ago -
A resonance tube can be used to measure the speed of sound in
air. A tuning...
asked 45 minutes ago