
Homework Answers
(a)
| C.I | frequency |
| 13.07-37.07 | 19 |
| 37.07-61.07 | 6 |
| 61.07-85.07 | 3 |
| 85.07-109.07 | 2 |
| Total | 30 |
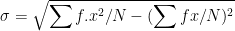
(b)
![histogram 20 18 16 14 12 10 13.07,37.07] 37.07, 61.07) (85.07, 109.07 (61.07,85.07)](http://img.homeworklib.com/questions/5b781ec0-191d-11ec-8f10-c98f7c34aa3e.png?x-oss-process=image/resize,w_560)
(c) N=30 , N/2 =15
| C.I | frequency | cf |
| 13.07-37.07 | 19 | 19 |
| 37.07-61.07 | 6 | 25 |
| 61.07-85.07 | 3 | 28 |
| 85.07-109.07 | 2 | 30 |
| Total | 30 |
The value just greater than 15 in cf column is 19 , corresponding CI is 13.07-37.07
13.07-37.07 is the median class
Median = L + h* (N/2 -c)/f
where L = lower limit if median class = 13.07
h = width =24
c = cumulative frequency of the class preceding the median class =0
f = frequency of the median class =19
Therefore
Median = 32.02
Q1= L + h* (N/4 -c)/f
L=13.07, h =24, c =0, f =19
Q1=22.54
Q3= L + h* (3N/4 -c)/f
L= 37.07, h=24, c=19, f= 6
Q3= 51.07
(d)
| C.I | frequency | x | fx | fx^2 |
| 13.07-37.07 | 19 | 25.07 | 476.33 | 11941.59 |
| 37.07-61.07 | 6 | 49.07 | 294.42 | 14447.19 |
| 61.07-85.07 | 3 | 73.07 | 219.21 | 16017.67 |
| 85.07-109.07 | 2 | 97.07 | 194.14 | 18845.17 |
| 30 | 1184.1 | 61251.63 |

= 483.84
= 21.9964
(e)

= 500.5241
s= 22.3724
(f) z score = 
= (67.18-39.47) / 21.9964
= 1.26
Note : 
(g) 90% Confidence interval is

= 
= (32.86, 46.07)
Note : For 90% confidence , zc =1.645
Add Answer to:
12. Consider the following data set of a given characteristic. 34.35242 28-62 86.66 51-29 2020 14.32...
18. Given the table of measurements 24 26 3028 29 28 29 29 25 3026 29...
 18. Given the table of measurements 24 26 3028 29 28 29 29 25 3026 29 27 31 32 28 2827 27 26 27 25 29 27 30 28 27 28 a. Make a tally histogram. b. Make a histogram for the individual measurements. c. Make a grouped histogram with the first group 24 to 25, the second group 26 to 27, etoc. 22. Use a statistical calculator to check the results for , o, and s in the following:...
n du Consider the data set below: 22 12 21 22 S = 19 45 20...
 n du Consider the data set below: 22 12 21 22 S = 19 45 20 30 37 34 44 23 26 33 70 54 40 48 23 17 22 56 38 17 21 16 33 41 84 43 27 65 34 19 100 34 48 29 54 16 43 33 8934 43 31 37 77 43 43 Problem 1 (a) Make a stem and leaf display of S. (b) Calculate the mean I = 2 (c) Calculate the 10%-trimmed...
A sample set is as the following with a missing value χι。It is known that χ...
 A sample set is as the following with a missing value χι。It is known that χ = 18 16 | 16 | 18 | 18 | 20 | 20 | 20 | 22 | 30 | 35 What is the missing data value of the data set? What is the median? What is the variance? What is the variance, if this is a population? Does it skew? (Right, Left, or Not) 7. 10. A po^ulation is listed as the followin...
apter 1. Consider the following data on distances traveled by 100 people to visit the local...
 apter 1. Consider the following data on distances traveled by 100 people to visit the local park. 1-8 30 25 20 15 10 9-16 17-24 25-32 33-40 Expand and construct the table adding columns for relative frequency and cumulative relative frequency. Then plot Histogram, Frequency Polygon and Ogive Curve. 2. Math test anxiety can be found throughout the general population. A study of 200 seniors at a local high school was conducted. The following table was produced from the data....
Use the sample data and confidence level given below to complete parts (a) through (d). A...
 Use the sample data and confidence level given below to complete parts (a) through (d). A research instituto poll asked respondents if they felt vulnerable to identity theft. In the poll, n=1052 and x 515 who said "yos." Use a 95% confidence level. Click the icon to view a table of z scores. *) Find the best point estimate of the population proportion p. (Round to three decimal places as needed.) b) Identify the value of the margin of error...
Find the standard error of estimate for the given paired data. 9) The equation of the...
 Find the standard error of estimate for the given paired data. 9) The equation of the regression line for the paired data below isy -3x. Find the standard error of estimate x 2 4 5 6 у|711 13 20 A) 5.00 D) 2.2361 B) 6.2750 C) 4.1892 A-2 Classify the conclusion of the hypothesis test as a Tye end customary ee for dar dlinic for this 10) A health insurer has determined that the procedure is $1200. They suspect that...
Use the sample data and confidence level given below to complete parts (a) through (d). A...
 Use the sample data and confidence level given below to complete parts (a) through (d). A research institute poil asked respondents if they felt vulnerable to identity theft. In the poll, n=990 and x = 599 who said "yes." Use a 90% confidence level. Click the icon to view a table of z scores a) Find the best point estimate of the population proportion p. (Round to three decimal places as needed.) b) Identify the value of the margin of...
ntroduce your scenario and data set. Provide a brief overview of the scenario you are given...
ntroduce your scenario and data set. Provide a brief overview of the scenario you are given above and the data set that you will be analyzing. Classify the variables in your data set. Which variables are quantitative/qualitative? Which variables are discrete/continuous? Describe the level of measurement for each variable included in your data set. Discuss the importance of the Measures of Center and the Measures of Variation. What are the measures of center and why are they important? What are...
Please Answer ONLY F1, F2 and G . Thanks Problem: Daycare Management You've been hired as...
 Please Answer ONLY F1, F2 and G .
Thanks
Problem: Daycare Management You've been hired as the Chief Statistician for the SummerlsFun Co. The corporation operates a variety of Summer Children Camp/Daycare chains: ParentsOasis SunAndPlay NoPlaceLikeHome As part of their ongoing marketing effort, SummerIsFun Co. collects a variety of statistics about their members. The database includes the following data (a) Child's age category: infant, toddlers, preschool, pre-K к} (b) Child's BMI category: underweight, normal weight overweight, obese (e) Number of...
Please Answer ONLY F1, F2 and G .
Thanks
Problem: Daycare Management You've been hired as the Chief Statistician for the SummerlsFun Co. The corporation operates a variety of Summer Children Camp/Daycare chains: ParentsOasis SunAndPlay NoPlaceLikeHome As part of their ongoing marketing effort, SummerIsFun Co. collects a variety of statistics about their members. The database includes the following data (a) Child's age category: infant, toddlers, preschool, pre-K к} (b) Child's BMI category: underweight, normal weight overweight, obese (e) Number of...
All of the following questions are in relation to the following journal article which is available...
 All of the following questions are in relation to the following journal article which is available on Moodle: Parr CL, Magnus MC, Karlstad O, Holvik K, Lund-Blix NA, Jaugen M, et al. Vitamin A and D intake in pregnancy, infant supplementation and asthma development: the Norwegian Mother and Child Cohort. Am J Clin Nutr 2018:107:789-798 QUESTIONS: 1. State one hypothesis the author's proposed in the manuscript. 2. There is previous research that shows that adequate Vitamin A intake is required...
 18. Given the table of measurements 24 26 3028 29 28 29 29 25 3026 29 27 31 32 28 2827 27 26 27 25 29 27 30 28 27 28 a. Make a tally histogram. b. Make a histogram for the individual measurements. c. Make a grouped histogram with the first group 24 to 25, the second group 26 to 27, etoc. 22. Use a statistical calculator to check the results for , o, and s in the following:...
 n du Consider the data set below: 22 12 21 22 S = 19 45 20 30 37 34 44 23 26 33 70 54 40 48 23 17 22 56 38 17 21 16 33 41 84 43 27 65 34 19 100 34 48 29 54 16 43 33 8934 43 31 37 77 43 43 Problem 1 (a) Make a stem and leaf display of S. (b) Calculate the mean I = 2 (c) Calculate the 10%-trimmed...
 A sample set is as the following with a missing value χι。It is known that χ = 18 16 | 16 | 18 | 18 | 20 | 20 | 20 | 22 | 30 | 35 What is the missing data value of the data set? What is the median? What is the variance? What is the variance, if this is a population? Does it skew? (Right, Left, or Not) 7. 10. A po^ulation is listed as the followin...
 apter 1. Consider the following data on distances traveled by 100 people to visit the local park. 1-8 30 25 20 15 10 9-16 17-24 25-32 33-40 Expand and construct the table adding columns for relative frequency and cumulative relative frequency. Then plot Histogram, Frequency Polygon and Ogive Curve. 2. Math test anxiety can be found throughout the general population. A study of 200 seniors at a local high school was conducted. The following table was produced from the data....
 Use the sample data and confidence level given below to complete parts (a) through (d). A research instituto poll asked respondents if they felt vulnerable to identity theft. In the poll, n=1052 and x 515 who said "yos." Use a 95% confidence level. Click the icon to view a table of z scores. *) Find the best point estimate of the population proportion p. (Round to three decimal places as needed.) b) Identify the value of the margin of error...
 Find the standard error of estimate for the given paired data. 9) The equation of the regression line for the paired data below isy -3x. Find the standard error of estimate x 2 4 5 6 у|711 13 20 A) 5.00 D) 2.2361 B) 6.2750 C) 4.1892 A-2 Classify the conclusion of the hypothesis test as a Tye end customary ee for dar dlinic for this 10) A health insurer has determined that the procedure is $1200. They suspect that...
 Use the sample data and confidence level given below to complete parts (a) through (d). A research institute poil asked respondents if they felt vulnerable to identity theft. In the poll, n=990 and x = 599 who said "yes." Use a 90% confidence level. Click the icon to view a table of z scores a) Find the best point estimate of the population proportion p. (Round to three decimal places as needed.) b) Identify the value of the margin of...
 Please Answer ONLY F1, F2 and G .
Thanks
Problem: Daycare Management You've been hired as the Chief Statistician for the SummerlsFun Co. The corporation operates a variety of Summer Children Camp/Daycare chains: ParentsOasis SunAndPlay NoPlaceLikeHome As part of their ongoing marketing effort, SummerIsFun Co. collects a variety of statistics about their members. The database includes the following data (a) Child's age category: infant, toddlers, preschool, pre-K к} (b) Child's BMI category: underweight, normal weight overweight, obese (e) Number of...
Please Answer ONLY F1, F2 and G .
Thanks
Problem: Daycare Management You've been hired as the Chief Statistician for the SummerlsFun Co. The corporation operates a variety of Summer Children Camp/Daycare chains: ParentsOasis SunAndPlay NoPlaceLikeHome As part of their ongoing marketing effort, SummerIsFun Co. collects a variety of statistics about their members. The database includes the following data (a) Child's age category: infant, toddlers, preschool, pre-K к} (b) Child's BMI category: underweight, normal weight overweight, obese (e) Number of...
 All of the following questions are in relation to the following journal article which is available on Moodle: Parr CL, Magnus MC, Karlstad O, Holvik K, Lund-Blix NA, Jaugen M, et al. Vitamin A and D intake in pregnancy, infant supplementation and asthma development: the Norwegian Mother and Child Cohort. Am J Clin Nutr 2018:107:789-798 QUESTIONS: 1. State one hypothesis the author's proposed in the manuscript. 2. There is previous research that shows that adequate Vitamin A intake is required...
Most questions answered within 3 hours.
-
Experimental studies of cancer often use strains of animals that
have a naturally high incidence of...
asked 1 minute ago -
Sociology Question Emile Durkheim
What role does mass media play in the lives of contemporary
citizens?...
asked 6 minutes ago -
Why would you silence gene expression for both wild-type and
mutants? I am on a question...
asked 15 minutes ago -
While all of the elements below are helpful, Booth et al. (2008)
emphasize that it is...
asked 19 minutes ago -
2. Use the three-step method to analyze the effects of the event
on the equilibrium price...
asked 19 minutes ago -
Draw a Venn diagram of three domains of life and explain.
asked 23 minutes ago -
In testing a new drug, researchers found that 5% of all patients
using it will have...
asked 52 minutes ago -
List the six general types of information management systems,
and give one logistics application to each...
asked 43 minutes ago -
XYZ corporation uses statistical quality control to monitor the
quality of their product. They have determined...
asked 46 minutes ago -
If a liquid
contains 60% sugar and 40% water through out its composition then
what is...
asked 54 minutes ago -
The data in set A represents prices (with tax included) of a
large cup of regular...
asked 1 hour ago -
How do neuropsychological assessments provide information about
impairment? How could this information be misused?
asked 56 minutes ago