#17 You are given the sample mean and the population standard deviation. Use this information to...
#17
You are given the sample mean and the population standard deviation. Use this information to construct the 90% and 95% confidence intervals for the population mean. Which interval is wider? If convenient, use technology to construct the confidence intervals.
A random sample of 34 gas grills has a mean price of $648.20
Assume the population standard deviation is $56.70
The 90% confidence interval is
(______,______).
Homework Answers
Here we assume that the population standard deviation is $56.70
So we can use Z interval.
Let's use minitab
Step 1) Click on Stat>>>Basic Statistics >>1 sample Z...
Click on summarized data
Sample size = 34
Mean = 648.20
Standard deviation = 56.70
Step 2) then click on Option
Confidence level = 90.0
Alternative "not equal "
then click on OK
again click on OK
So we get the following output:
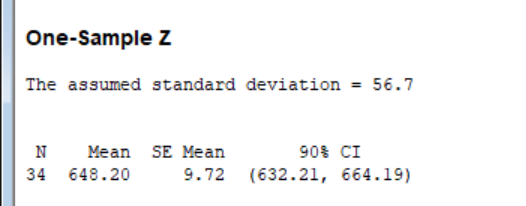
From the above output the 90% confidence interval for population mean is (632.21, 664.19)
The width of this interval = 664.19 - 632.21 = 31.98
Let's find 95% confidence interval for population mean.
Here we assume that the population standard deviation is $56.70
So we can use Z interval.
Let's use minitab
Step 1) Click on Stat>>>Basic Statistics >>1 sample Z...
Click on summarized data
Sample size = 34
Mean = 648.20
Standard deviation = 56.70
Step 2) then click on Option
Confidence level = 95.0
Alternative "not equal "
then click on OK
again click on OK
So we get the following output:

From the above output the 90% confidence interval for population mean is (629.14, 667.26)
The width of this interval = 667.26 -629.14 = 38.12
95% confidence interval is wider than the 90% confidence interval.
Add Answer to:
#17
You are given the sample mean and the population standard
deviation. Use this information to...
You are given the sample mean and the population standard deviation. Use this information to construct...
You are given the sample mean and the population standard deviation. Use this information to construct the 90% and 95% confidence intervals for the population mean. Which interval is wider? If convenient, use technology to construct the confidence intervals. A random sample of 45 gas grills has a mean price of $648.40 Assume the population standard deviation is $56.50 The 90% confidence interval is
You are given the sample mean and the population standard deviation. Use this information to construct...
You are given the sample mean and the population standard deviation. Use this information to construct the 90% and 95% confidence intervals for the population mean. Interpret the results and compare the widths of the confidence intervals. If convenient, use technology to construct the confidence intervals. A random sample of 60 home theater systems has a mean price of $135.00 . Assume the population standard deviation is $15.90 . A.) the 90% confidence interval is B.) the 95% confidence interval...
You are given the sample mean and the population standard deviation. Use this information to construct...
You are given the sample mean and the population standard deviation. Use this information to construct the 90% and 95% confidence intervals for the population mean. Interpret the results and compare the widths of the confidence intervals. If convenient, use technology to construct the confidence intervals. A random sample of 45 home theater systems has a mean price of $127.00. Assume the population standard deviation is $19.20. Construct a 90% confidence interval for the population mean. The 90% confidence interval...
You are given the sample mean and the population standard deviation. Use this information to construct...
You are given the sample mean and the population standard deviation. Use this information to construct the 90% and 95% confidence intervals for the population mean. Interpret the results and compare the widths of the confidence intervals. If convenient, use technology to construct the confidence intervals. A random sample of 60 home theater systems has a mean price of $113.00. Assume the population standard deviation is $17.90. Construct a 90% confidence interval for the population mean
You are given the sample mean and the population standard deviation. Use this information to construct...
 You are given the sample mean and the population standard deviation. Use this information to construct the 90% and 95% confidence ntervals for the population mean. Interpret the results and compare the widths of the confidence intervals. If convenient, use technology to construct the confidence intervals A random sample of 45 home theater systems has a mean price of $138.00. Assume the population standard deviation is 516.40. Construct a 90% confidence interval for the population mean. The 90% confidence interval...
AM You are given the sample mean and the population standard deviation. Use this information to...
 AM You are given the sample mean and the population standard deviation. Use this information to construct the 90% and 95% confidence intervals for the population mean. Interpret the results and compare the widths of the confidence intervals. If convenient, use technology to construct the confidence intervals. A random sample of 35 home theater systems has a mean price of $144.00. Assume the population standard deviation is $15.60. Construct a 90% confidence interval for the population mean. The 90% confidence...
You are given the sample mean and the population standard deviation. Use this information to construct...
You are given the sample mean and the population standard deviation. Use this information to construct the 90% and 95% confidence intervals for the population mean. Interpret the results and compare the widths of the confidence intervals. From a random sample of 49 business days, the mean closing price of a certain stock was $113.41. Assume the population standard deviation is $11.13. a) The 90% confidence interval is (?) - (?)
you are given the sample mean and the population and standard deviation. use this information to...
you are given the sample mean and the population and standard deviation. use this information to construct the 90% and 95% confidence intervals for the population mean. interpret the results and compare the widths of the confidence intervals. from a random sample of 77 dates, the mean record high daily temp in a certain city has a mean of 85.13 degrees F, assume the population standard deviation is 15.32 degrees F the 90% confidence interval is? the 95% confidence interval...
You are given the sample mean and the population standard deviation. Use this information to construct...
 You are given the sample mean and the population standard deviation. Use this information to construct the 90% and 95% confidence intervals for the population mean. Interpret the results and compare the widths of the confidence intervals. From a random sample of 39 business days, the mean closing price of a certain stock was $113.67. Assume the population standard deviation is $10.91. The 90% confidence interval is (1 , b). (Round to two decimal places as needed.)
You are given the sample mean and the population standard deviation. Use this information to construct...
 You are given the sample mean and the population standard deviation. Use this information to construct the 90% and 95% confidence intervals for the population mean. Interpret the results and compare the widths of the confidence intervals. From a random sample of 64 dates, the mean record high daily temperature in a certain city has a mean of 85.80°F. Assume the population standard deviation is 15.07°F. The 90% confidence interval is (ID). (Round to two decimal places as needed.) The...
 You are given the sample mean and the population standard deviation. Use this information to construct the 90% and 95% confidence ntervals for the population mean. Interpret the results and compare the widths of the confidence intervals. If convenient, use technology to construct the confidence intervals A random sample of 45 home theater systems has a mean price of $138.00. Assume the population standard deviation is 516.40. Construct a 90% confidence interval for the population mean. The 90% confidence interval...
 AM You are given the sample mean and the population standard deviation. Use this information to construct the 90% and 95% confidence intervals for the population mean. Interpret the results and compare the widths of the confidence intervals. If convenient, use technology to construct the confidence intervals. A random sample of 35 home theater systems has a mean price of $144.00. Assume the population standard deviation is $15.60. Construct a 90% confidence interval for the population mean. The 90% confidence...
 You are given the sample mean and the population standard deviation. Use this information to construct the 90% and 95% confidence intervals for the population mean. Interpret the results and compare the widths of the confidence intervals. From a random sample of 39 business days, the mean closing price of a certain stock was $113.67. Assume the population standard deviation is $10.91. The 90% confidence interval is (1 , b). (Round to two decimal places as needed.)
 You are given the sample mean and the population standard deviation. Use this information to construct the 90% and 95% confidence intervals for the population mean. Interpret the results and compare the widths of the confidence intervals. From a random sample of 64 dates, the mean record high daily temperature in a certain city has a mean of 85.80°F. Assume the population standard deviation is 15.07°F. The 90% confidence interval is (ID). (Round to two decimal places as needed.) The...
Most questions answered within 3 hours.
-
Why is the answer b), for this question? I came up with C) for
my incorrect...
asked 53 seconds ago -
Suppose that you know that in the population of full-time
employees in the United States, the...
asked 22 minutes ago -
This experiment was designed originally to sample various meat and carcass quality
aspects of Ontario pigs...
asked 23 minutes ago -
Dopamine Hydrochloride: draw the structure And Show the
functional groups in different colors and label the...
asked 15 minutes ago -
A rope supports a 10 kg dumbbell hanging from it. What is the
tension in the...
asked 14 minutes ago -
) Raw materials are studied for contamination. Suppose that
the number of particles of contamination per...
asked 37 minutes ago -
After running a regression analysis we calculated an F test and
the significance level was 0.15....
asked 33 minutes ago -
----Can someone please help me solve this one using JAVA
----I thank you in advance
Create...
asked 38 minutes ago -
1. What force primarily attracts the potassium ion to
the nitrate ion?
a. London forces...
asked 39 minutes ago -
What are the negative effects of abruptly stopping the use of
all fossil fuels? Give at...
asked 46 minutes ago -
Given that many conflict are the result of different parties having
different interests, is it possible...
asked 51 minutes ago -
A 750 g block can slide uniformly along the horizontal track
when a string attached to...
asked 54 minutes ago