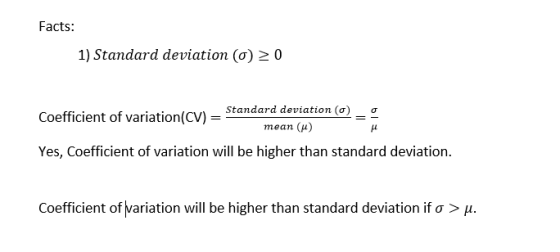
Can the coefficient of variation be higher than the standard deviation? If so, under what circumstances?
Can the coefficient of variation be higher than the standard deviation? If so, under what circumstances?
Homework Answers
Add Answer to:
Can the coefficient of
variation be higher than the standard deviation? If so, under what
circumstances?
QUESTION 28 The expected returns, standard deviation, and coefficient variation of Stocks A and B are...
 QUESTION 28 The expected returns, standard deviation, and coefficient variation of Stocks A and B are given below. If you are risk adverse investor, which stock will you buy? | Stocks | Expected Return Std. Deviation Coefficient Variation, CV A 15% 4% 0.27 B 12% 3% 0.25 O Stock A since expected return is higher Stock B since standard deviation is lower O Stock A since coefficient variation is higher Stock B since coefficient variation is lower O Need additional...
8.2 The coefficient of variation is a better measure of stand-alone risk than standard deviation because...
 8.2
The coefficient of variation is a better measure of stand-alone risk than standard deviation because it is a standardized measure of risk per unit; it is calculated as the -Select- divided by the expected return. The coefficient of variation shows the risk per unit of return, so it provides a more meaningful risk measure when the expected returns on two alternatives are not -Select- .. The Sharpe ratio compares the asset's realized excess return to its -Select- over a...
8.2
The coefficient of variation is a better measure of stand-alone risk than standard deviation because it is a standardized measure of risk per unit; it is calculated as the -Select- divided by the expected return. The coefficient of variation shows the risk per unit of return, so it provides a more meaningful risk measure when the expected returns on two alternatives are not -Select- .. The Sharpe ratio compares the asset's realized excess return to its -Select- over a...
The coefficient of variation CV describes the standard deviation as a percent of the mean. Because...
 The coefficient of variation CV describes the standard deviation as a percent of the mean. Because it has no units, you can use the coefficient of variation to compare data with different units. Find the coefficient of variation for each sample data set. What can you conclude? Standard deviation CV Mean Click the loon to view the data sets. 0 Data Table - 100% Creights - % (Round to the nearest tenth as needed.) Heights Weights Print Done
Coefficient of Variation The coefficient of variation standardizes a variable's dispersion (standard deviation) relative to its mean. Imagine two variables, each with a standard deviation of 20....
 Coefficient of Variation The coefficient of variation standardizes a variable's dispersion (standard deviation) relative to its mean. Imagine two variables, each with a standard deviation of 20. If Variable 1 has a mean of 100 and Variable 2 has a mean of 10, it is obvious that has more relative uncertainty. The coefficient of variation, the amount of risk per unit of the mean, is found by dividing the standard deviation by the mean, as follows: CV = Standard Deviation...
Standard deviation versus coefficient of variation as measures of risk Greengage, Inc., a successful nursery, is...
 Standard deviation versus coefficient of variation as measures of risk Greengage, Inc., a successful nursery, is considering several expansion projects. All of the alternatives promise to produce an acceptable return. Data on four possible projects appear in the following table ! a. Which project is least risky, judging on the basis of range? Data Table b. Which project has the lowest standard deviation? Explain why standard deviation may not be an entirely appropriate measure of risk for purposes of this...
This data is from a sample. Calculate the mean, standard deviation, and coefficient of variation. 49.1...
 This data is from a sample. Calculate the mean, standard deviation, and coefficient of variation. 49.1 41.2 21.9 40.5 17.5 35.2 30.3 Please show the following answers to 2 decimal places. Mean - Standard Deviation - Coefficient of Variation % (Please enter a whole number.)
what does Coefficient of Variation tell us (how is it useful) and what does Standard Deviation...
what does Coefficient of Variation tell us (how is it useful) and what does Standard Deviation tell us? If the SD is $7,000, what does it mean? Please try to explain in the easiest way
Find the (a) expected return, (b) standard deviation and (c) coefficient of variation for these investments...
 Find the (a) expected return, (b) standard deviation and (c) coefficient of variation for these investments A and B. RA Prob. 20% 0.40 10% 0.3 -2% 0.30 A's expected return, standard deviation, and coefficient of variation are: 7%, 12.6%, 1.87 O 8%, 12.5%, 1.56 8%,1.6%, 0.2
The coefficient of variation CV describes the standard deviation as a percent of the mean. Because...
 The coefficient of variation CV describes the standard deviation as a percent of the mean. Because it has no units, you can use the coefficient of variation to compare data with different units. Find the coefficient of variation for each sample data set. What can you conclude? Standard deviation CV 100 % Mean Click the lcon to view the data sets CVgh5.1% (Round to the nearest tenth as needed.) (Round to the nearest tenth as needed) cV More Enter your...
Relative variation is computed as coefficient of variation, which is (standard deviation)/mean x 100 Paste B...
 Relative variation is computed as coefficient of variation,
which is (standard deviation)/mean x 100
Paste B Seniors-kg B25 D Fill in your name and net id above. Fill in the blanks for Sophomore and Senior data. 1 decimal place. Answer the question about Relative Dispersion below. Save the file as a ".PDF" file as "Your name.pdf" Upload to Tracs Assignments. Do not use email. Supply Descriptive statistics for the SAMPLE Weight Date at the left: show statistics first for Sophomores,...
Relative variation is computed as coefficient of variation,
which is (standard deviation)/mean x 100
Paste B Seniors-kg B25 D Fill in your name and net id above. Fill in the blanks for Sophomore and Senior data. 1 decimal place. Answer the question about Relative Dispersion below. Save the file as a ".PDF" file as "Your name.pdf" Upload to Tracs Assignments. Do not use email. Supply Descriptive statistics for the SAMPLE Weight Date at the left: show statistics first for Sophomores,...
 QUESTION 28 The expected returns, standard deviation, and coefficient variation of Stocks A and B are given below. If you are risk adverse investor, which stock will you buy? | Stocks | Expected Return Std. Deviation Coefficient Variation, CV A 15% 4% 0.27 B 12% 3% 0.25 O Stock A since expected return is higher Stock B since standard deviation is lower O Stock A since coefficient variation is higher Stock B since coefficient variation is lower O Need additional...
 8.2
The coefficient of variation is a better measure of stand-alone risk than standard deviation because it is a standardized measure of risk per unit; it is calculated as the -Select- divided by the expected return. The coefficient of variation shows the risk per unit of return, so it provides a more meaningful risk measure when the expected returns on two alternatives are not -Select- .. The Sharpe ratio compares the asset's realized excess return to its -Select- over a...
8.2
The coefficient of variation is a better measure of stand-alone risk than standard deviation because it is a standardized measure of risk per unit; it is calculated as the -Select- divided by the expected return. The coefficient of variation shows the risk per unit of return, so it provides a more meaningful risk measure when the expected returns on two alternatives are not -Select- .. The Sharpe ratio compares the asset's realized excess return to its -Select- over a...
 The coefficient of variation CV describes the standard deviation as a percent of the mean. Because it has no units, you can use the coefficient of variation to compare data with different units. Find the coefficient of variation for each sample data set. What can you conclude? Standard deviation CV Mean Click the loon to view the data sets. 0 Data Table - 100% Creights - % (Round to the nearest tenth as needed.) Heights Weights Print Done
 Coefficient of Variation The coefficient of variation standardizes a variable's dispersion (standard deviation) relative to its mean. Imagine two variables, each with a standard deviation of 20. If Variable 1 has a mean of 100 and Variable 2 has a mean of 10, it is obvious that has more relative uncertainty. The coefficient of variation, the amount of risk per unit of the mean, is found by dividing the standard deviation by the mean, as follows: CV = Standard Deviation...
 Standard deviation versus coefficient of variation as measures of risk Greengage, Inc., a successful nursery, is considering several expansion projects. All of the alternatives promise to produce an acceptable return. Data on four possible projects appear in the following table ! a. Which project is least risky, judging on the basis of range? Data Table b. Which project has the lowest standard deviation? Explain why standard deviation may not be an entirely appropriate measure of risk for purposes of this...
 This data is from a sample. Calculate the mean, standard deviation, and coefficient of variation. 49.1 41.2 21.9 40.5 17.5 35.2 30.3 Please show the following answers to 2 decimal places. Mean - Standard Deviation - Coefficient of Variation % (Please enter a whole number.)
 Find the (a) expected return, (b) standard deviation and (c) coefficient of variation for these investments A and B. RA Prob. 20% 0.40 10% 0.3 -2% 0.30 A's expected return, standard deviation, and coefficient of variation are: 7%, 12.6%, 1.87 O 8%, 12.5%, 1.56 8%,1.6%, 0.2
 The coefficient of variation CV describes the standard deviation as a percent of the mean. Because it has no units, you can use the coefficient of variation to compare data with different units. Find the coefficient of variation for each sample data set. What can you conclude? Standard deviation CV 100 % Mean Click the lcon to view the data sets CVgh5.1% (Round to the nearest tenth as needed.) (Round to the nearest tenth as needed) cV More Enter your...
 Relative variation is computed as coefficient of variation,
which is (standard deviation)/mean x 100
Paste B Seniors-kg B25 D Fill in your name and net id above. Fill in the blanks for Sophomore and Senior data. 1 decimal place. Answer the question about Relative Dispersion below. Save the file as a ".PDF" file as "Your name.pdf" Upload to Tracs Assignments. Do not use email. Supply Descriptive statistics for the SAMPLE Weight Date at the left: show statistics first for Sophomores,...
Relative variation is computed as coefficient of variation,
which is (standard deviation)/mean x 100
Paste B Seniors-kg B25 D Fill in your name and net id above. Fill in the blanks for Sophomore and Senior data. 1 decimal place. Answer the question about Relative Dispersion below. Save the file as a ".PDF" file as "Your name.pdf" Upload to Tracs Assignments. Do not use email. Supply Descriptive statistics for the SAMPLE Weight Date at the left: show statistics first for Sophomores,...
Most questions answered within 3 hours.
-
One member in the comp set that did not have supply, demand, and
revenue data. What...
asked 1 minute from now -
1. Methods of collecting data - Experiments and direct
observation
In each of the following situations,...
asked 3 minutes ago -
What is the density of a substance that takes up 3.4e3 cubic cm
and weighs 1.96...
asked 13 minutes ago -
Consider a single wire loop of radius a. Calculate the magnetic
field B(z) along the axis...
asked 10 minutes ago -
For each of the compounds listed below you must draw the Lewis
dot structure in the...
asked 12 minutes ago -
1. Hypothesize in what type of environments it would be
advantageous for a protist to be...
asked 12 minutes ago -
Each protein is composed of a maximum of ____________ different
amino acids in varying numbers and...
asked 20 minutes ago -
The mayor of a town has proposed a plan for the construction of
a new community....
asked 31 minutes ago -
2. KopyKat is a firm that specializes in printing business cards
using the latest laser technology....
asked 50 minutes ago -
What type of stock pays dividends in arrears?
A.
Nonminus−cumulative
preferred stock
B.
Cumulative preferred stock...
asked 48 minutes ago -
Discuss what issues you see as needing to be addressed in an
organization in order to...
asked 50 minutes ago -
Why does varying input frequency to a buck converter affect the
magnitude of the output voltage...
asked 53 minutes ago