The accuracy of a census report on a city in southern California was questioned by some government officials. A random sample of 1215 people living in the city was used to check the report, and the results are shown below.
| Ethnic Origin | Census Percent | Sample Result |
| Black | 10% | 128 |
| Asian | 3% | 45 |
| Anglo | 38% | 478 |
| Latino/Latina | 41% | 492 |
| Native American | 6% | 60 |
| All others | 2% | 12 |
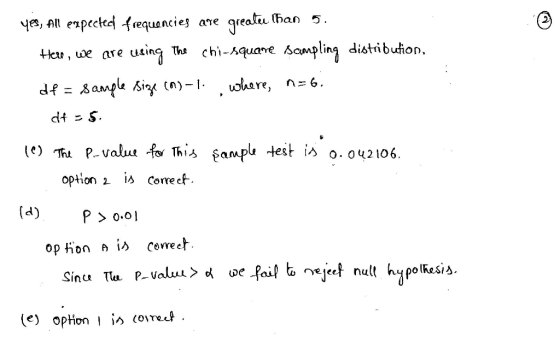
Using a 1% level of significance, test the claim that the census distribution and the sample distribution agree.
(a) What is the level of significance?
State the null and alternate hypotheses. CHOOSE THE CORRECT
ANSWER
H0: The distributions are different.
H1: The distributions are
different.H0: The distributions are the
same.
H1: The distributions are the
same. H0: The
distributions are different.
H1: The distributions are the
same.H0: The distributions are the same.
H1: The distributions are different.

Homework Answers

Add Answer to:
The accuracy of a census report on a city in southern California
was questioned by some...
The accuracy of a census report on a city in southern California was questioned by some...
The accuracy of a census report on a city in southern California was questioned by some government officials. A random sample of 1215 people living in the city was used to check the report, and the results are shown below. Ethnic Origin Census Percent Sample Result Black 10% 130 Asian 3% 35 Anglo 38% 462 Latino/Latina 41% 516 Native American 6% 62 All others 2% 10 Using a 1% level of significance, test the claim that the census distribution and...
The age distribution of the Canadian population and the age distribution of a random sample of 455 residents in the Indian community of a village are shown below. Age (years) Percent of Canadian Po...
The age distribution of the Canadian population and the age distribution of a random sample of 455 residents in the Indian community of a village are shown below. Age (years) Percent of Canadian Population Observed Number in the Village Under 5 7.2% 48 5 to 14 13.6% 79 15 to 64 67.1% 281 65 and older 12.1% 47 Use a 5% level of significance to test the claim that the age distribution of the general Canadian population fits the age...
The age distribution of the Canadian population and the age distribution of a random sample of...
The age distribution of the Canadian population and the age distribution of a random sample of 455 residents in the Indian community of a village are shown below. Age (years) Percent of Canadian Population Observed Number in the Village Under 5 7.2% 52 5 to 14 13.6% 75 15 to 64 67.1% 282 65 and older 12.1% 46 Use a 5% level of significance to test the claim that the age distribution of the general Canadian population fits the age...
The Fish and Game Department stocked a lake with fish in the following proportions: 30% catfish,...
The Fish and Game Department stocked a lake with fish in the following proportions: 30% catfish, 15% bass, 40% bluegill, and 15% pike. Five years later it sampled the lake to see if the distribution of fish had changed. It found that the 500 fish in the sample were distributed as follows. Catfish Bass Bluegill Pike 112 91 224 73 In the 5-year interval, did the distribution of fish change at the 0.05 level? (i) State the null and alternate...
The types of raw materials used to construct stone tools found at an archaeological site are...
The types of raw materials used to construct stone tools found at an archaeological site are shown below. A random sample of 1486 stone tools were obtained from a current excavation site. Raw Material Regional Percent of Stone Tools Observed Number of Tools as Current excavation Site Basalt 61.3% 924 Obsidian 10.6% 151 Welded Tuff 11.4% 166 Pedernal chert 13.1% 190 Other 3.6% 55 Use a 1% level of significance to test the claim that the regional distribution of raw...
He accuracy of a census report on a city is Southern California was questioned by some...
 He accuracy of a census report on a city is Southern
California was questioned by some gov officials. A random sample of
1215 people living in the city was used to check the report and the
results are shown here:
Using a 1% level of significance, that the claim that census
distribution and sample distribution agree.
3. The accuracy of a census report on a city is southern California was questioned by some government officials. A random sample of 1215...
He accuracy of a census report on a city is Southern
California was questioned by some gov officials. A random sample of
1215 people living in the city was used to check the report and the
results are shown here:
Using a 1% level of significance, that the claim that census
distribution and sample distribution agree.
3. The accuracy of a census report on a city is southern California was questioned by some government officials. A random sample of 1215...
A machine that puts corn flakes into boxes is adjusted to put an average of 15.3...
A machine that puts corn flakes into boxes is adjusted to put an average of 15.3 ounces into each box, with standard deviation of 0.23 ounce. If a random sample of 15 boxes gave a sample standard deviation of 0.36 ounce, do these data support the claim that the variance has increased and the machine needs to be brought back into adjustment? (Use a 0.01 level of significance.) (i) Give the value of the level of significance. 0.01 State the...
The following table shows age distribution and location of a random sample of 166 buffalo in...
The following table shows age distribution and location of a random sample of 166 buffalo in a national park. Age Lamar District Nez Perce District Firehole District Row Total Calf 13 13 15 41 Yearling 13 11 9 33 Adult 35 28 29 92 Column Total 61 52 53 166 Use a chi-square test to determine if age distribution and location are independent at the 0.05 level of significance. (a) What is the level of significance? State the null and...
Random samples of two species of iris gave the following petal lengths (in cm). x1, Iris virginica 5.1 5.9 4.5 4.9 5.7 4.8 5.8 6.4 5.7 5.9 x2, Iris versicolor 4.5 4.3 4.7 5.0 3.8 5.1 4.4 4.2 (a) Use a...
Random samples of two species of iris gave the following petal lengths (in cm). x1, Iris virginica 5.1 5.9 4.5 4.9 5.7 4.8 5.8 6.4 5.7 5.9 x2, Iris versicolor 4.5 4.3 4.7 5.0 3.8 5.1 4.4 4.2 (a) Use a 5% level of significance to test the claim that the population standard deviation of x1 is larger than 0.55. What is the level of significance? State the null and alternate hypotheses. H0: σ = 0.55; H1: σ > 0.55...
A set of solar batteries is used in a research satellite. The satellite can run on...
A set of solar batteries is used in a research satellite. The satellite can run on only one battery, but it runs best if more than one battery is used. The variance σ2 of lifetimes of these batteries affects the useful lifetime of the satellite before it goes dead. If the variance is too small, all the batteries will tend to die at once. Why? If the variance is too large, the batteries are simply not dependable. Why? Engineers have...
 He accuracy of a census report on a city is Southern
California was questioned by some gov officials. A random sample of
1215 people living in the city was used to check the report and the
results are shown here:
Using a 1% level of significance, that the claim that census
distribution and sample distribution agree.
3. The accuracy of a census report on a city is southern California was questioned by some government officials. A random sample of 1215...
He accuracy of a census report on a city is Southern
California was questioned by some gov officials. A random sample of
1215 people living in the city was used to check the report and the
results are shown here:
Using a 1% level of significance, that the claim that census
distribution and sample distribution agree.
3. The accuracy of a census report on a city is southern California was questioned by some government officials. A random sample of 1215...
Most questions answered within 3 hours.
-
You are to assess the biomechanics of a male’s arm using his
bicep to hold a...
asked 26 minutes ago -
What is the maximum number of grams of N-acetyl-p-toluidine can
be prepared from 70. milliliters of...
asked 1 hour ago -
A researcher is using a two-tailed hypothesis test with α =
.05 to evaluate the effect...
asked 3 hours ago -
Two long, straight wires are parallel and 8.5 cm apart. The top
wire carries a current...
asked 4 hours ago -
Three arguments used to promote trade barriers are the national
security argument, the infant-industry argument, and...
asked 5 hours ago -
Question 3:
Percentage of Completion
Method (12 marks) On January 1, 2017, Eagle Construction Ltd.
started...
asked 5 hours ago -
A company purchased a tract of land for its natural resources at
a cost of $2,042,900....
asked 5 hours ago -
1. These financial statement item are
for UPS Company at fiscal year-end, October 31, 2019.
...
asked 5 hours ago -
PYTHON HOMEWORK
When an object is falling because of gravity, the following
formula can be used...
asked 5 hours ago -
Which of the following groups is comprised solely of
chemoheterotrophs?
Click all that apply.
animals
fungi...
asked 5 hours ago -
What is the feminist theory in 100 words or more?
book: Juvenile Justice In America, Clemens...
asked 5 hours ago -
1) What is the probability of a randomly selected value from a
normally distributed population falling...
asked 5 hours ago