
Homework Answers
|
Income Statement |
|||
|
2016 |
2015 |
Change in % |
|
|
Operating Revenues |
|||
|
Patient Service Revenue |
150118 |
123565 |
21.49 |
|
Less: Bad Debts |
2000 |
1800 |
11.11 |
|
Net patient service revenue |
148118 |
121765 |
21.64 |
|
Premium revenue |
18782 |
1645 |
1041.76 |
|
Other revenue |
3079 |
2704 |
13.87 |
|
Net operating revenues |
169979 |
126114 |
34.78 |
|
Expenses |
|||
|
Salaries and benefit |
126223 |
102334 |
23.34 |
|
Supplies |
20568 |
18673 |
10.15 |
|
Insurance |
4518 |
3710 |
21.78 |
|
Lease |
3189 |
2603 |
22.51 |
|
Depreciation |
6405 |
5798 |
10.47 |
|
Interest |
5329 |
3476 |
53.31 |
|
Total Expense |
166232 |
136594 |
21.70 |
|
Operating Income |
3747 |
4330 |
-13.46 |
|
Non-operating income |
243 |
198 |
22.73 |
|
Investment income |
3870 |
3678 |
5.22 |
|
Total non-operating income |
4113 |
3876 |
6.11 |
|
Net income |
7860 |
8206 |
-4.22 |
Recommendations:
Despite the increase in net operating revenue and total non-operating income, the company’s net profit has been depleted by 4.22% due to an increase in expenses and a decrease in operating income. So, it recommended decreasing the expenses especially with respect to interest paid, employee benefits, negotiate on lease cost and insurance.
|
Balance Sheet |
|||
|
2016 |
2015 |
Change in % |
|
|
Assets |
|||
|
Current assets |
|||
|
Cash and Cash Equivalent |
12102 |
6486 |
86.59 |
|
Short-term investment |
10000 |
5000 |
100.00 |
|
Net patient account receivable |
28509 |
25927 |
9.96 |
|
Inventories |
3695 |
2302 |
60.51 |
|
Total current assets |
54306 |
39715 |
36.74 |
|
Long term investment |
54059 |
31837 |
69.80 |
|
Net property and equipment’s |
52450 |
49549 |
5.85 |
|
Total assets |
160815 |
121101 |
32.79 |
|
Liabilities and Net Assets |
|||
|
Current Liabilities |
|||
|
Notes payable |
4334 |
3345 |
29.57 |
|
Accounts payable |
5022 |
6933 |
-27.56 |
|
Accrued expenses |
6069 |
5037 |
20.49 |
|
Total current liabilities |
15425 |
15315 |
0.72 |
|
Long term debt |
85322 |
53578 |
59.25 |
|
Total liabilities |
100747 |
68893 |
46.24 |
|
Net assets |
|||
|
Unrestricted |
54068 |
46208 |
17.01 |
|
Temporarily unrestricted |
1000 |
1000 |
0.00 |
|
Permanently restricted |
5000 |
5000 |
0.00 |
|
Total net assets |
60068 |
52208 |
15.06 |
|
Total liabilities and net assets |
160815 |
121101 |
32.79 |
Recommendation:
Despite there is a considerable total net asset by 15.06%, if the liabilities are reduced especially with respect to long term debts, notes payable and accrued expenses the company could gain an additional asset value.
Add Answer to:
Gapenski’s Fundamentals of Healthcare Third Edition. Income
statement which is Exhibit 11.2 on page 327 and...
Review the income statement which is Exhibit 11.2 on page 327 of our text and the...
 Review the income statement which is Exhibit 11.2 on page 327
of our text and the balance sheet which is Exhibit 12.2 on page
356.
Describe the differences or changes from 2015 to 2016 relating
to the income and expenses of the firm.
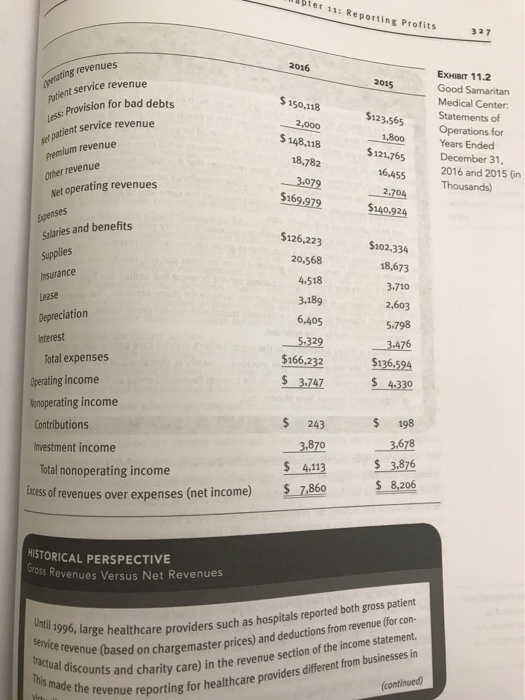
EXHIBIT 11.2 Good Samaritan Medical Center: 2016 2015 Operating revenues Statements of Patient service revenue $150,118 $123,565 Operations for Years Ended Less: Provision for bad debts 1,800 2,000 December 31 Net patient service revenue $148,118 $121,765 2016...
Review the income statement which is Exhibit 11.2 on page 327
of our text and the balance sheet which is Exhibit 12.2 on page
356.
Describe the differences or changes from 2015 to 2016 relating
to the income and expenses of the firm.
EXHIBIT 11.2 Good Samaritan Medical Center: 2016 2015 Operating revenues Statements of Patient service revenue $150,118 $123,565 Operations for Years Ended Less: Provision for bad debts 1,800 2,000 December 31 Net patient service revenue $148,118 $121,765 2016...
How does Tampa Clinic’s statement of cash flows compare with Sunnyvale’s statement? Exhibit 4.6. The 2018...
 How does Tampa Clinic’s statement of cash flows compare with
Sunnyvale’s statement? Exhibit 4.6.
The 2018 Income Statement and Balance Sheet of Tampa Clinic, a not-for-profit organization, are presented below Tampa Clinic Income statement Year Ended December 31, 2018 Operating Revenues: Patient service revenue Less provision for bad debts Net patient service revenue Other revenue Net operating revenues $524,630 (27.630) $497,000 10,000 $507 000 Expenses: Salaries and benefits Supplies Insurance Depreciation Interest Total expenses Operating income $231,950 76,050 16,700 8,000...
How does Tampa Clinic’s statement of cash flows compare with
Sunnyvale’s statement? Exhibit 4.6.
The 2018 Income Statement and Balance Sheet of Tampa Clinic, a not-for-profit organization, are presented below Tampa Clinic Income statement Year Ended December 31, 2018 Operating Revenues: Patient service revenue Less provision for bad debts Net patient service revenue Other revenue Net operating revenues $524,630 (27.630) $497,000 10,000 $507 000 Expenses: Salaries and benefits Supplies Insurance Depreciation Interest Total expenses Operating income $231,950 76,050 16,700 8,000...
The 2018 Income Statement and Balance Sheet of Tampa Clinic, a not-for-profit organization, are presented below....
The 2018 Income Statement and Balance Sheet of Tampa Clinic, a not-for-profit organization, are presented below. Tampa Clinic Income Statement Year Ended December 31, 2018 Operating Revenues: Patient service revenue $524,630 Less provision for bad debts (27,630) Net patient service revenue $497,000 Other revenue 10,000 Net operating revenues $507,000 Expenses: Salaries and benefits $231,950 Supplies 76,050 Insurance 16,700 Depreciation 8,000 Interest 41,000 Total expenses $373,700 Operating income $133,300...
The 2018 Income Statement and Balance Sheet of Tampa Clinic, a not-for-profit organization, are presented below...
 The 2018 Income Statement and Balance Sheet of Tampa Clinic, a not-for-profit organization, are presented below Tampa Clinic Income statement Year Ended December 31, 2018 Operating Revenues: Patient service revenue Less provision for bad debts Net patient service revenue Other revenue Net operating revenues $524,630 (27.630) $497,000 10,000 $507 000 Expenses: Salaries and benefits Supplies Insurance Depreciation Interest Total expenses Operating income $231,950 76,050 16,700 8,000 41,000 9373,700 $133,300 Nonoperating income Investment income Net income 700 Dncernber 31, 201s 2018...
The 2018 Income Statement and Balance Sheet of Tampa Clinic, a not-for-profit organization, are presented below....
 The 2018 Income Statement and Balance Sheet of Tampa Clinic, a not-for-profit organization, are presented below. Tampa Clinic Income Statement Year Ended December 31, 2018 Operating Revenues: Patient service revenue $524,630 Less provision for bad debts (27630) $497,000 Net patient service revenue Other revenue Net operating revenues 10,000 $507,000 Expenses: Salaries and benefits Supplies Insurance Depreciation Interest Total expenses Operating income Nonoperating income: Investment income Net income $231,950 76,050 16,700 8,000 41,000 $373,700 $133,300 S 2,700 $136,000 Tampa Clinic Balance...
2015 2014 Operating Revenues: Patient service revenue $ 150,118 2,000 $ 148,118 18,782 3,079 $ 169,979...
 2015 2014 Operating Revenues: Patient service revenue $ 150,118 2,000 $ 148,118 18,782 3,079 $ 169,979 s: Provision for bad debts Net patient service revenue EXHIBIT 3.1 Sunnyvale Clinic: Statements of Operations, Years Ended December 31, 2015 and 2014 (in thousands) $123,565 1,800 $ 121,765 16,455 2,704 $140,924 Premium revenue Other revenue Net operating revenues Expenses: $ 126,223 20,568 Salaries and benefits Supplies Insurance 4,518 3,189 6,405 5,329 $ 166,232 $ 3,747 $102,334 18,673 3,710 2,603 5,798 3,476 $ 136,594...
a. How does this income statement differ from the ones presented in Exhibit 3.1 and Problem...
 a. How does this income statement differ from the ones presented
in Exhibit 3.1 and Problem 3.2?
b. Why does Green Valley show a provision for income taxes while
the other two income statements did not?
c. What is Green Valley’s total profit margin? How does this
value compare with the values for Sunnyvale Clinic and
BestCare?
d. The before-tax profit margin for Green Valley is operating
income divided by total revenues. Calculate Green Valley’s
before-tax profit margin. Why may...
a. How does this income statement differ from the ones presented
in Exhibit 3.1 and Problem 3.2?
b. Why does Green Valley show a provision for income taxes while
the other two income statements did not?
c. What is Green Valley’s total profit margin? How does this
value compare with the values for Sunnyvale Clinic and
BestCare?
d. The before-tax profit margin for Green Valley is operating
income divided by total revenues. Calculate Green Valley’s
before-tax profit margin. Why may...
Calculate 5 year net sales, operating expenses, operating income, and net income and interpret th...
 calculate 5 year net sales, operating expenses, operating
income, and net income and interpret the resulting data and explain
the significance of the trend
Jiranna Healthcare Income Statement December 31, 2013 (in thousands) 2010 2011 2012 2013 12,050 Gross patient services revenues (non-GAAP) Less deductions from revenues (non-GAAP) Net patient service revenues Other operating revenues 8,870 9,490 10,400 11,200 890) 1,000) (1.500 9,400 679 10,079 600 8,090 519 8,609 8,600 633 9,233 9,700 10,450 980 11,430 Total operating revenues 10,417...
calculate 5 year net sales, operating expenses, operating
income, and net income and interpret the resulting data and explain
the significance of the trend
Jiranna Healthcare Income Statement December 31, 2013 (in thousands) 2010 2011 2012 2013 12,050 Gross patient services revenues (non-GAAP) Less deductions from revenues (non-GAAP) Net patient service revenues Other operating revenues 8,870 9,490 10,400 11,200 890) 1,000) (1.500 9,400 679 10,079 600 8,090 519 8,609 8,600 633 9,233 9,700 10,450 980 11,430 Total operating revenues 10,417...
Balance sheets and income statements for Nordstrom, Inc., follow. Refer to these financial statements to answer the requ...
Balance sheets and income statements for Nordstrom, Inc., follow. Refer to these financial statements to answer the requirements. Nordstrom, Inc. Consolidated Statements of Earnings For Fiscal Years Ended ($ millions) 2016 2015 2014 Net Sales $14,095 $13,110 $12,166 Credit card revenues 342 396 374 Total revenues 14,437 13,506 12,540 Cost of sales and related buying and occupancy costs (9,168) (8,406) (7,737) Selling, general and administrative expenses (4,168) (3,777) (3,453) Earnings before interest and income taxes 1,101 1,323 1,350 Interest expense,...
Analysis and Interpretation of Profitability Balance sheets and income statements for Nordstrom, Inc., follow. Refer to...
 Analysis and Interpretation of Profitability Balance sheets and income statements for Nordstrom, Inc., follow. Refer to these financial statements to answer the requirements. Nordstrom, Inc. Consolidated Statements of Earnings For Fiscal Years Ended ($ millions) 2016 2015 2014 Net Sales $14,095 $13,110 $12,166 Credit card revenues 342 396 374 Total revenues 14,437 13,506 12,540 Cost of sales and related buying and occupancy costs (9,168) (8,406) (7,737) Selling, general and administrative expenses (4,168) (3,777) (3,453) Earnings before interest and income taxes...
 Review the income statement which is Exhibit 11.2 on page 327
of our text and the balance sheet which is Exhibit 12.2 on page
356.
Describe the differences or changes from 2015 to 2016 relating
to the income and expenses of the firm.
EXHIBIT 11.2 Good Samaritan Medical Center: 2016 2015 Operating revenues Statements of Patient service revenue $150,118 $123,565 Operations for Years Ended Less: Provision for bad debts 1,800 2,000 December 31 Net patient service revenue $148,118 $121,765 2016...
Review the income statement which is Exhibit 11.2 on page 327
of our text and the balance sheet which is Exhibit 12.2 on page
356.
Describe the differences or changes from 2015 to 2016 relating
to the income and expenses of the firm.
EXHIBIT 11.2 Good Samaritan Medical Center: 2016 2015 Operating revenues Statements of Patient service revenue $150,118 $123,565 Operations for Years Ended Less: Provision for bad debts 1,800 2,000 December 31 Net patient service revenue $148,118 $121,765 2016...
 How does Tampa Clinic’s statement of cash flows compare with
Sunnyvale’s statement? Exhibit 4.6.
The 2018 Income Statement and Balance Sheet of Tampa Clinic, a not-for-profit organization, are presented below Tampa Clinic Income statement Year Ended December 31, 2018 Operating Revenues: Patient service revenue Less provision for bad debts Net patient service revenue Other revenue Net operating revenues $524,630 (27.630) $497,000 10,000 $507 000 Expenses: Salaries and benefits Supplies Insurance Depreciation Interest Total expenses Operating income $231,950 76,050 16,700 8,000...
How does Tampa Clinic’s statement of cash flows compare with
Sunnyvale’s statement? Exhibit 4.6.
The 2018 Income Statement and Balance Sheet of Tampa Clinic, a not-for-profit organization, are presented below Tampa Clinic Income statement Year Ended December 31, 2018 Operating Revenues: Patient service revenue Less provision for bad debts Net patient service revenue Other revenue Net operating revenues $524,630 (27.630) $497,000 10,000 $507 000 Expenses: Salaries and benefits Supplies Insurance Depreciation Interest Total expenses Operating income $231,950 76,050 16,700 8,000...
 The 2018 Income Statement and Balance Sheet of Tampa Clinic, a not-for-profit organization, are presented below Tampa Clinic Income statement Year Ended December 31, 2018 Operating Revenues: Patient service revenue Less provision for bad debts Net patient service revenue Other revenue Net operating revenues $524,630 (27.630) $497,000 10,000 $507 000 Expenses: Salaries and benefits Supplies Insurance Depreciation Interest Total expenses Operating income $231,950 76,050 16,700 8,000 41,000 9373,700 $133,300 Nonoperating income Investment income Net income 700 Dncernber 31, 201s 2018...
 The 2018 Income Statement and Balance Sheet of Tampa Clinic, a not-for-profit organization, are presented below. Tampa Clinic Income Statement Year Ended December 31, 2018 Operating Revenues: Patient service revenue $524,630 Less provision for bad debts (27630) $497,000 Net patient service revenue Other revenue Net operating revenues 10,000 $507,000 Expenses: Salaries and benefits Supplies Insurance Depreciation Interest Total expenses Operating income Nonoperating income: Investment income Net income $231,950 76,050 16,700 8,000 41,000 $373,700 $133,300 S 2,700 $136,000 Tampa Clinic Balance...
 2015 2014 Operating Revenues: Patient service revenue $ 150,118 2,000 $ 148,118 18,782 3,079 $ 169,979 s: Provision for bad debts Net patient service revenue EXHIBIT 3.1 Sunnyvale Clinic: Statements of Operations, Years Ended December 31, 2015 and 2014 (in thousands) $123,565 1,800 $ 121,765 16,455 2,704 $140,924 Premium revenue Other revenue Net operating revenues Expenses: $ 126,223 20,568 Salaries and benefits Supplies Insurance 4,518 3,189 6,405 5,329 $ 166,232 $ 3,747 $102,334 18,673 3,710 2,603 5,798 3,476 $ 136,594...
 a. How does this income statement differ from the ones presented
in Exhibit 3.1 and Problem 3.2?
b. Why does Green Valley show a provision for income taxes while
the other two income statements did not?
c. What is Green Valley’s total profit margin? How does this
value compare with the values for Sunnyvale Clinic and
BestCare?
d. The before-tax profit margin for Green Valley is operating
income divided by total revenues. Calculate Green Valley’s
before-tax profit margin. Why may...
a. How does this income statement differ from the ones presented
in Exhibit 3.1 and Problem 3.2?
b. Why does Green Valley show a provision for income taxes while
the other two income statements did not?
c. What is Green Valley’s total profit margin? How does this
value compare with the values for Sunnyvale Clinic and
BestCare?
d. The before-tax profit margin for Green Valley is operating
income divided by total revenues. Calculate Green Valley’s
before-tax profit margin. Why may...
 calculate 5 year net sales, operating expenses, operating
income, and net income and interpret the resulting data and explain
the significance of the trend
Jiranna Healthcare Income Statement December 31, 2013 (in thousands) 2010 2011 2012 2013 12,050 Gross patient services revenues (non-GAAP) Less deductions from revenues (non-GAAP) Net patient service revenues Other operating revenues 8,870 9,490 10,400 11,200 890) 1,000) (1.500 9,400 679 10,079 600 8,090 519 8,609 8,600 633 9,233 9,700 10,450 980 11,430 Total operating revenues 10,417...
calculate 5 year net sales, operating expenses, operating
income, and net income and interpret the resulting data and explain
the significance of the trend
Jiranna Healthcare Income Statement December 31, 2013 (in thousands) 2010 2011 2012 2013 12,050 Gross patient services revenues (non-GAAP) Less deductions from revenues (non-GAAP) Net patient service revenues Other operating revenues 8,870 9,490 10,400 11,200 890) 1,000) (1.500 9,400 679 10,079 600 8,090 519 8,609 8,600 633 9,233 9,700 10,450 980 11,430 Total operating revenues 10,417...
 Analysis and Interpretation of Profitability Balance sheets and income statements for Nordstrom, Inc., follow. Refer to these financial statements to answer the requirements. Nordstrom, Inc. Consolidated Statements of Earnings For Fiscal Years Ended ($ millions) 2016 2015 2014 Net Sales $14,095 $13,110 $12,166 Credit card revenues 342 396 374 Total revenues 14,437 13,506 12,540 Cost of sales and related buying and occupancy costs (9,168) (8,406) (7,737) Selling, general and administrative expenses (4,168) (3,777) (3,453) Earnings before interest and income taxes...
Most questions answered within 3 hours.
-
A lean manufacturing system basically removes all waste,
including inventory, as much as possible. An ideal...
asked 2 minutes ago -
Write a JAVA program to sort a given array of integers (1
Dimensional) in ascending order...
asked 13 minutes ago -
The table below shows the number of deaths in the U.S. in a year
due to...
asked 32 minutes ago -
The solubility of magnesium phosphate is 2.27 × 10⁻³ g/1.0 L of
solution. What is the...
asked 50 minutes ago -
Two tugboats pull a disabled supertanker. Each tug exerts a
constant force of 1.20×10⁶ N ,...
asked 44 minutes ago -
In the following concepts of economics provide a
discussion of the meaning as well as the...
asked 19 minutes ago -
Suppose we now care about the long run decisions of a firm that
has a production...
asked 32 minutes ago -
Outline the major trends shaping franchising
asked 50 minutes ago -
. Pendulum Inc. uses moving-average costing. Its 20X8
ending inventory is 900 units that have an...
asked 48 minutes ago -
This is a question about selling :
Abby has been working with a couple for a...
asked 52 minutes ago -
For water, Kf = 1.86 °C∙kg/mole, Kb = 0.52 °C∙kg/mole and
density = 1.00 g/mL. Calculate...
asked 1 hour ago -
Why in 100 words Social Darwinism have such broad appeal? please
type
asked 1 hour ago