Table 9.1 Number of Prey Captured Per Trial Color of Prey Total Trials 1-10 % of...
Table 9.1
|
Number of Prey Captured Per Trial |
||||||||||||
|
Color of Prey |
Total Trials 1-10 |
% of Total |
||||||||||
|
Pink |
21 |
26% |
||||||||||
|
Red |
8 |
10% |
||||||||||
|
White |
17 |
21% |
||||||||||
|
Yellow |
20 |
25.3% |
||||||||||
|
Green |
13 |
16.4% |
||||||||||
|
Grand Total Captured 79 |
100% |
|||||||||||
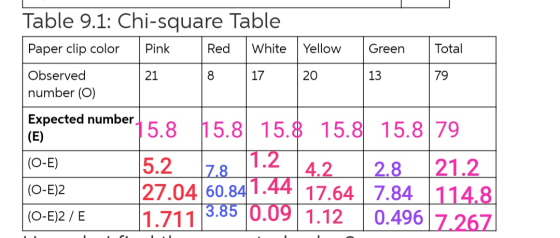
Table 9.1: Chi-square Table
|
Paper clip color |
Pink |
Red |
White |
Yellow |
Green |
Total |
|
Observed number (O) |
21 |
8 |
17 |
20 |
13 |
79 |
|
Expected number (E) |
||||||
|
(O-E) |
||||||
|
(O-E)2 |
||||||
|
(O-E)2 / E |
How do I find the expected value?
Homework Answers
Null hypothesis: The number of prey captured should be found in equal proprtion. That's why the expected number of each type should be (1/5) ×79= 15. 8
Now look in the image for chi square test:
please rate.
Add Answer to:
Table 9.1
Number
of Prey Captured Per Trial
Color of Prey
Total
Trials 1-10
% of...
State the null hypothesis. Sally was interested in whether the number of m&m's was uniform over all 6 colors (the same number of m&m's for each color). The table categorizes the numbe...
 State the null hypothesis. Sally was interested in whether the number of m&m's was uniform over all 6 colors (the same number of m&m's for each color). The table categorizes the number of m&m's of each color found in an 1-pound bag Color Brown Red Yellow Blue Orange Green Number 70 85 81 79 93 96 State the appropriate null hypothesis for a Chi-square goodness-of-fit test. Ho: The proportion of each color is Ho : The number of m&m's is...
1. What would be the phenotype for each of the following birds, including their gender? Color...
1. What would be the phenotype for each of the following birds, including their gender? Color Gender Bb ZZi: - bb ZiZi: - BB ZZ: - bb ZW: - Bb ZiW: - 2. Using the phenotypes of the parents and of the progeny given in table 1, determine the genotype of each parent in the first nest. Male Female 3. Using the phenotypes of the parents and of the progeny given in table 2, determine the genotype of each parent...
Total #of men's per Bag/ it of people 53 SS 56 54 57 58 S 8...
 Total #of men's per Bag/ it of people 53 SS 56 54 57 58 S 8 13 in 3 2 1 59 Activity 14 [2 points): After checking many bags of M&M's, an M&M enthusiast believes that there should be about 58 plain M&M's per 1.69 oz. bag. Test this claim using the class data at the 0.05 level of significance. Hoi Activity 15 [2 points): Create a 95% confidence interval for the mean number of M&M's per bag, using...
Questions 45-46: Consider the following partial table of a sample of 60 M&Ms. We count how...
 Questions 45-46: Consider the following partial table of a sample of 60 M&Ms. We count how many of each color are present. We are testing the null hypothesis that each color has the stated proportion. Observed Counts Assumed Proportions Expected Counts 0.24 13 14 0.20 10 0.16 Color Blue Orange Green Yellow Red Brown Total 11 0.14 6 0.13 6 0.13 60 1.00 60 45. If the null hypothesis is correct, how many orange M&Ms do we expect to see...
1/30/2019 18. A certain type of candy is reported to be distributed with the color percentages...
 1/30/2019 18. A certain type of candy is reported to be distributed with the color percentages shown in the table below. The number of each color in a random bag of candy is also shown below. Use the chi-square goodness-of-fit test to decide whether the color distribution differs from the reported distribution. Use a = 0.05. Red Brown Blue 12 14 Color Percentage Frequency Green 17 Orange Yellow 1915 238 23 30 156 22 Determine the null and alternative hypotheses....
LABORATORY 6. MENDELIAN GENETICS: GENERAL REMARKS AND Drosophila 1. Are the genes for the body color,...
LABORATORY 6. MENDELIAN GENETICS: GENERAL REMARKS AND Drosophila 1. Are the genes for the body color, eye color, and wing shape recessive or dominant? Explain your answer. Yellow: _______________ White: _________________ Miniature: ____________ Sepia: _________________ Explanation: _________________________________________ _________________________________________ _________________________________________ _________________________________________ _________________________________________ 2. Where are these genes located? On an autosome(s) or sex chromosome? Explain your answer Yellow: _______________ White: _________________ Miniature: ____________ Sepia: _________________ Explanation: _________________________________________ _________________________________________ 2. Set up a X2 to test if the yellow (y) (body color)...
please help fast You are conducting a multinomial hypothesis test (a = 0.05) for the claim...
 please help fast
You are conducting a multinomial hypothesis test (a = 0.05) for the claim that all 5 categories are equally likely to be selected. Complete the table. Observed Expected Category Frequency Frequency A 21 B 15 с 20 D 7 E 6 Report all answers accurate to three decimal places. But retain unrounded numbers for future calculations. What is the chi-square test-statistic for this data? (Report answer accurate to three decimal places, and remember to use the unrounded...
please help fast
You are conducting a multinomial hypothesis test (a = 0.05) for the claim that all 5 categories are equally likely to be selected. Complete the table. Observed Expected Category Frequency Frequency A 21 B 15 с 20 D 7 E 6 Report all answers accurate to three decimal places. But retain unrounded numbers for future calculations. What is the chi-square test-statistic for this data? (Report answer accurate to three decimal places, and remember to use the unrounded...
Bag Blue Orange Green Yellow Red Brown Total Number of Candies 1 9 13 14 10...
Bag Blue Orange Green Yellow Red Brown Total Number of Candies 1 9 13 14 10 7 7 60 2 13 10 6 9 9 8 55 3 13 12 4 10 9 6 54 4 16 13 8 6 6 8 57 5 10 10 12 5 15 4 56 6 9 18 3 6 12 12 60 7 11 13 6 15 8 6 59 8 12 18 5 9 6 5 55 9 12 10 8 15...
Calculate the mean, median, and standard deviation for the total number of candies (per bag). Construct...
Calculate the mean, median, and standard deviation for the total number of candies (per bag). Construct a histogram of the total number of candies (per bag). Use the z-score method to identify any potential outliers and outliers. Assume the total number of candies is normally distributed, calculate the probability that a randomly sampled bag has at least 55 candies in a bag. If a random sample of 50 bags is selected, find the probability that the mean number of candies...
number 8 and 9 please with explanation A biologist documents the color patterns of the tiger...
 number 8 and 9 please with explanation
A biologist documents the color patterns of the tiger beetle (Cicindela fulgida) during spring and summer. Beetles can be toxic to birds. Beetles are red with yellow stripes. The red background can be dull (almost brown) or bright (crimson red). The biologist predicts more bright beetles in spring than in summer; the bright color contrasts better with the brown stem! than with green leaves. https://docs.google.com/document/u/1/d/106NDMISZIXT-AORKDFH2nmu-4PPIOCBboO015/mobilebasic 3/3/20, 9:4 Page JOUD eilisnis der 6. Which...
number 8 and 9 please with explanation
A biologist documents the color patterns of the tiger beetle (Cicindela fulgida) during spring and summer. Beetles can be toxic to birds. Beetles are red with yellow stripes. The red background can be dull (almost brown) or bright (crimson red). The biologist predicts more bright beetles in spring than in summer; the bright color contrasts better with the brown stem! than with green leaves. https://docs.google.com/document/u/1/d/106NDMISZIXT-AORKDFH2nmu-4PPIOCBboO015/mobilebasic 3/3/20, 9:4 Page JOUD eilisnis der 6. Which...
 State the null hypothesis. Sally was interested in whether the number of m&m's was uniform over all 6 colors (the same number of m&m's for each color). The table categorizes the number of m&m's of each color found in an 1-pound bag Color Brown Red Yellow Blue Orange Green Number 70 85 81 79 93 96 State the appropriate null hypothesis for a Chi-square goodness-of-fit test. Ho: The proportion of each color is Ho : The number of m&m's is...
 Total #of men's per Bag/ it of people 53 SS 56 54 57 58 S 8 13 in 3 2 1 59 Activity 14 [2 points): After checking many bags of M&M's, an M&M enthusiast believes that there should be about 58 plain M&M's per 1.69 oz. bag. Test this claim using the class data at the 0.05 level of significance. Hoi Activity 15 [2 points): Create a 95% confidence interval for the mean number of M&M's per bag, using...
 Questions 45-46: Consider the following partial table of a sample of 60 M&Ms. We count how many of each color are present. We are testing the null hypothesis that each color has the stated proportion. Observed Counts Assumed Proportions Expected Counts 0.24 13 14 0.20 10 0.16 Color Blue Orange Green Yellow Red Brown Total 11 0.14 6 0.13 6 0.13 60 1.00 60 45. If the null hypothesis is correct, how many orange M&Ms do we expect to see...
 1/30/2019 18. A certain type of candy is reported to be distributed with the color percentages shown in the table below. The number of each color in a random bag of candy is also shown below. Use the chi-square goodness-of-fit test to decide whether the color distribution differs from the reported distribution. Use a = 0.05. Red Brown Blue 12 14 Color Percentage Frequency Green 17 Orange Yellow 1915 238 23 30 156 22 Determine the null and alternative hypotheses....
 please help fast
You are conducting a multinomial hypothesis test (a = 0.05) for the claim that all 5 categories are equally likely to be selected. Complete the table. Observed Expected Category Frequency Frequency A 21 B 15 с 20 D 7 E 6 Report all answers accurate to three decimal places. But retain unrounded numbers for future calculations. What is the chi-square test-statistic for this data? (Report answer accurate to three decimal places, and remember to use the unrounded...
please help fast
You are conducting a multinomial hypothesis test (a = 0.05) for the claim that all 5 categories are equally likely to be selected. Complete the table. Observed Expected Category Frequency Frequency A 21 B 15 с 20 D 7 E 6 Report all answers accurate to three decimal places. But retain unrounded numbers for future calculations. What is the chi-square test-statistic for this data? (Report answer accurate to three decimal places, and remember to use the unrounded...
 number 8 and 9 please with explanation
A biologist documents the color patterns of the tiger beetle (Cicindela fulgida) during spring and summer. Beetles can be toxic to birds. Beetles are red with yellow stripes. The red background can be dull (almost brown) or bright (crimson red). The biologist predicts more bright beetles in spring than in summer; the bright color contrasts better with the brown stem! than with green leaves. https://docs.google.com/document/u/1/d/106NDMISZIXT-AORKDFH2nmu-4PPIOCBboO015/mobilebasic 3/3/20, 9:4 Page JOUD eilisnis der 6. Which...
number 8 and 9 please with explanation
A biologist documents the color patterns of the tiger beetle (Cicindela fulgida) during spring and summer. Beetles can be toxic to birds. Beetles are red with yellow stripes. The red background can be dull (almost brown) or bright (crimson red). The biologist predicts more bright beetles in spring than in summer; the bright color contrasts better with the brown stem! than with green leaves. https://docs.google.com/document/u/1/d/106NDMISZIXT-AORKDFH2nmu-4PPIOCBboO015/mobilebasic 3/3/20, 9:4 Page JOUD eilisnis der 6. Which...
Most questions answered within 3 hours.
-
c++ program need help
Write a function allBigger that takes 3 parameters: 2 arrays of floats...
asked 8 minutes ago -
Underwater mortgages ~ A mortgage is termed “underwater” if the
amount owed is greater than the...
asked 7 minutes ago -
A 25ml pipet sample of an alcohol is found
asked 9 minutes ago -
8. The presidents of the past century have a mean height of 70.3
inches and a...
asked 12 minutes ago -
What do you think is the most difficult item for the union to
negotiate? Why?
asked 11 minutes ago -
Should non-profit organizations post their strategic plan on
their website? What about corporations? Why?
asked 27 minutes ago -
An unknown substance has a mass of 16.7 g. The temperature of
the substance increases by...
asked 36 minutes ago -
A toy cannon uses a spring to project a 5.21-g soft rubber ball.
The spring is...
asked 36 minutes ago -
what is balanced chemical equation including
states of matter of Nal + Na2CO3?
asked 35 minutes ago -
An archer shoots an arrow at a bottle. The arrow flys at 34m/s.
There is a...
asked 44 minutes ago -
Multiple choice data structures questions about stacks.
Here is an INCORRECT pseudocode for the algorithm which...
asked 50 minutes ago -
Osmotic forces related to protein concentration differences are
referred to as ________ forces.
asked 54 minutes ago