Construct a pivot table (frequency table) of the data from Manufacturing Example xlsx What is the...
Homework Answers
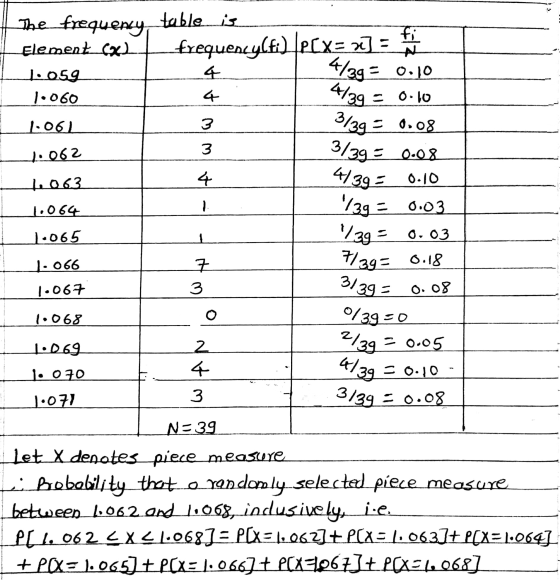
The probability that a randomly selected piece measures between 1.062 & 1.068, inclusively is 0.49

Add Answer to:
Construct a pivot table (frequency table) of the data from
Manufacturing Example xlsx
What is the...
Construct a pivot table (frequency table) of the data from Manufacturing Example xlsx What is the...
Construct a pivot table (frequency table) of the data from Manufacturing Example xlsx What is the probability that a randomly selected piece measures exactly 1.062? Round to 2 decimals (ie, 0.04) Inspection Data L1 1.062 1.066 1.066 1.06 1.066 1.066 1.06 1.059 1.067 1.064 1.066 1.063 1.06 1.06 1.067 1.065 1.059 1.066 1.07 1.063 1.062 1.071 1.061 1.061 1.071 1.066 1.063 1.07 1.069 1.059 1.059 1.067 1.063 1.062 1.07 1.061 1.07 1.069 1.071
T Distribution Table The U.S. Dairy Industry wants to estimate the mean yearly milk consumption. A...
 T Distribution Table
The U.S. Dairy Industry wants to estimate the mean yearly milk consumption. A sample of 25 people reveals the mean yearly consumption to be 82 gallons with a standard deviation of 24 gallons. Assume that the population distribution is normal. (Use Distribution Table.) a-1. What is the value of the population mean? 82 24 Unknown a-2. What is the best estimate of this value? Estimate population mean c. For a 90% confidence interval, what is the value...
T Distribution Table
The U.S. Dairy Industry wants to estimate the mean yearly milk consumption. A sample of 25 people reveals the mean yearly consumption to be 82 gallons with a standard deviation of 24 gallons. Assume that the population distribution is normal. (Use Distribution Table.) a-1. What is the value of the population mean? 82 24 Unknown a-2. What is the best estimate of this value? Estimate population mean c. For a 90% confidence interval, what is the value...
A random sample of 20 chocolate energy bars of a certain brand has, on average, 210...
 A random sample of 20 chocolate energy bars of a certain brand has, on average, 210 calories per bar, with a standard deviation of 15 calories. Construct a 99% confidence interval for the true mean calorie content of this brand of energy bar. Assume that the distribution of the calorie content is approximately normal. Click here to view page 1 of the standard normal distribution table. Click here to view page 2 of the standard normal distribution table. Click here...
(a) Is there a difference in the measurement of the muzzle velocity between device A and...
 (a) Is there a difference
in the measurement of the muzzle velocity between device A and
device B at the α = 0.01 level of significance? Note: A normal
probability plot and boxplot of the data indicate that the
differences are approximately normally distributed with no
outliers. Let di = Ai − Bi.
(i) Identify the null and alternative
hypotheses.
(ii) Determine the test statistic for
this hypothesis test (t0 = ?). Round to two
decimal places as needed.
(iii)...
(a) Is there a difference
in the measurement of the muzzle velocity between device A and
device B at the α = 0.01 level of significance? Note: A normal
probability plot and boxplot of the data indicate that the
differences are approximately normally distributed with no
outliers. Let di = Ai − Bi.
(i) Identify the null and alternative
hypotheses.
(ii) Determine the test statistic for
this hypothesis test (t0 = ?). Round to two
decimal places as needed.
(iii)...
t-distribution Table -Distribution Area in Right Tail 0.025 0.02 df 0.25 0.20 0.15 0.10 0.05 0.01...
 t-distribution Table -Distribution Area in Right Tail 0.025 0.02 df 0.25 0.20 0.15 0.10 0.05 0.01 0.005 0.0025 0.001 0.0005 3 6 1.000 1.3761.963 0.816 1.061 1.386 0.765 0.978 1.250 0.741 0.941 1.190 0.727 0.9201.156 0.718 0.906 1.134 0.7110.8961.119 0.706 0.889 1.108 0.703 0.883 1.100 0.700 0.879 1.093 0.697 0.876 1.088 0.695 0.873 1.083 0.694 0.870 1.079 0.692 0.868 1.076 0.691 0.866 1.074 0.690 0.865 1.071 0.689 0.863 1.069 0.688 0.862 1.067 0.688 0.861 1.066 3.078 1.886 1.638 1.533 1.476...
(a) Does the evidence suggest that community college transfer students take longer to attain a bachelor's...
 (a) Does the evidence suggest that community
college transfer students take longer to attain a bachelor's
degree? Use an α = 0.05 level of significance. Perform a hypothesis
test. Determine the null and alternative hypotheses.
(b) Determine the test statistic (t =
?) and the P-value (P = ?). Round to two decimal
places as needed.
(c) Construct a 90% confidence interval for
(μcommunity college − μno transfer) to
approximate the mean additional time it takes to complete a
bachelor's...
(a) Does the evidence suggest that community
college transfer students take longer to attain a bachelor's
degree? Use an α = 0.05 level of significance. Perform a hypothesis
test. Determine the null and alternative hypotheses.
(b) Determine the test statistic (t =
?) and the P-value (P = ?). Round to two decimal
places as needed.
(c) Construct a 90% confidence interval for
(μcommunity college − μno transfer) to
approximate the mean additional time it takes to complete a
bachelor's...
t-Distribution Area in Right Tail .
 t-Distribution Area in Right Tail
Degrees of Freedom 0.25 0.2
0.15 0.10 0.05
0.025 0.02 0.01
0.005 0.0025 0.001 0.0005
1 1.000 1.376 1.963
3.078 6.314 12.706
15.894 31.821 63.657
127.321 318.309 636.619
2 0.816 1.061 1.386
1.886 2.920 4.303
4.849 6.965 9.925
14.089 22.327 31.599
3 0.765 0.978 1.250
1.638 2.353 3.182
3.482 4.541 5.841
7.453 10.215 12.924
4 0.741 0.941 ...
t-Distribution Area in Right Tail
Degrees of Freedom 0.25 0.2
0.15 0.10 0.05
0.025 0.02 0.01
0.005 0.0025 0.001 0.0005
1 1.000 1.376 1.963
3.078 6.314 12.706
15.894 31.821 63.657
127.321 318.309 636.619
2 0.816 1.061 1.386
1.886 2.920 4.303
4.849 6.965 9.925
14.089 22.327 31.599
3 0.765 0.978 1.250
1.638 2.353 3.182
3.482 4.541 5.841
7.453 10.215 12.924
4 0.741 0.941 ...
 T Distribution Table
The U.S. Dairy Industry wants to estimate the mean yearly milk consumption. A sample of 25 people reveals the mean yearly consumption to be 82 gallons with a standard deviation of 24 gallons. Assume that the population distribution is normal. (Use Distribution Table.) a-1. What is the value of the population mean? 82 24 Unknown a-2. What is the best estimate of this value? Estimate population mean c. For a 90% confidence interval, what is the value...
T Distribution Table
The U.S. Dairy Industry wants to estimate the mean yearly milk consumption. A sample of 25 people reveals the mean yearly consumption to be 82 gallons with a standard deviation of 24 gallons. Assume that the population distribution is normal. (Use Distribution Table.) a-1. What is the value of the population mean? 82 24 Unknown a-2. What is the best estimate of this value? Estimate population mean c. For a 90% confidence interval, what is the value...
 A random sample of 20 chocolate energy bars of a certain brand has, on average, 210 calories per bar, with a standard deviation of 15 calories. Construct a 99% confidence interval for the true mean calorie content of this brand of energy bar. Assume that the distribution of the calorie content is approximately normal. Click here to view page 1 of the standard normal distribution table. Click here to view page 2 of the standard normal distribution table. Click here...
 (a) Is there a difference
in the measurement of the muzzle velocity between device A and
device B at the α = 0.01 level of significance? Note: A normal
probability plot and boxplot of the data indicate that the
differences are approximately normally distributed with no
outliers. Let di = Ai − Bi.
(i) Identify the null and alternative
hypotheses.
(ii) Determine the test statistic for
this hypothesis test (t0 = ?). Round to two
decimal places as needed.
(iii)...
(a) Is there a difference
in the measurement of the muzzle velocity between device A and
device B at the α = 0.01 level of significance? Note: A normal
probability plot and boxplot of the data indicate that the
differences are approximately normally distributed with no
outliers. Let di = Ai − Bi.
(i) Identify the null and alternative
hypotheses.
(ii) Determine the test statistic for
this hypothesis test (t0 = ?). Round to two
decimal places as needed.
(iii)...
 t-distribution Table -Distribution Area in Right Tail 0.025 0.02 df 0.25 0.20 0.15 0.10 0.05 0.01 0.005 0.0025 0.001 0.0005 3 6 1.000 1.3761.963 0.816 1.061 1.386 0.765 0.978 1.250 0.741 0.941 1.190 0.727 0.9201.156 0.718 0.906 1.134 0.7110.8961.119 0.706 0.889 1.108 0.703 0.883 1.100 0.700 0.879 1.093 0.697 0.876 1.088 0.695 0.873 1.083 0.694 0.870 1.079 0.692 0.868 1.076 0.691 0.866 1.074 0.690 0.865 1.071 0.689 0.863 1.069 0.688 0.862 1.067 0.688 0.861 1.066 3.078 1.886 1.638 1.533 1.476...
 (a) Does the evidence suggest that community
college transfer students take longer to attain a bachelor's
degree? Use an α = 0.05 level of significance. Perform a hypothesis
test. Determine the null and alternative hypotheses.
(b) Determine the test statistic (t =
?) and the P-value (P = ?). Round to two decimal
places as needed.
(c) Construct a 90% confidence interval for
(μcommunity college − μno transfer) to
approximate the mean additional time it takes to complete a
bachelor's...
(a) Does the evidence suggest that community
college transfer students take longer to attain a bachelor's
degree? Use an α = 0.05 level of significance. Perform a hypothesis
test. Determine the null and alternative hypotheses.
(b) Determine the test statistic (t =
?) and the P-value (P = ?). Round to two decimal
places as needed.
(c) Construct a 90% confidence interval for
(μcommunity college − μno transfer) to
approximate the mean additional time it takes to complete a
bachelor's...
 t-Distribution Area in Right Tail
Degrees of Freedom 0.25 0.2
0.15 0.10 0.05
0.025 0.02 0.01
0.005 0.0025 0.001 0.0005
1 1.000 1.376 1.963
3.078 6.314 12.706
15.894 31.821 63.657
127.321 318.309 636.619
2 0.816 1.061 1.386
1.886 2.920 4.303
4.849 6.965 9.925
14.089 22.327 31.599
3 0.765 0.978 1.250
1.638 2.353 3.182
3.482 4.541 5.841
7.453 10.215 12.924
4 0.741 0.941 ...
t-Distribution Area in Right Tail
Degrees of Freedom 0.25 0.2
0.15 0.10 0.05
0.025 0.02 0.01
0.005 0.0025 0.001 0.0005
1 1.000 1.376 1.963
3.078 6.314 12.706
15.894 31.821 63.657
127.321 318.309 636.619
2 0.816 1.061 1.386
1.886 2.920 4.303
4.849 6.965 9.925
14.089 22.327 31.599
3 0.765 0.978 1.250
1.638 2.353 3.182
3.482 4.541 5.841
7.453 10.215 12.924
4 0.741 0.941 ...
Most questions answered within 3 hours.
-
Accent Software faces the following conditions. All of these
support Accent’s use of a market-penetration pricing...
asked 50 minutes ago -
A mathematically inclined friend emails you the following
instructions: "Meet me in the cafeteria the first...
asked 53 minutes ago -
A monopoly sells in two countries . The demand curves in the two
countries are p1...
asked 1 hour ago -
A .15kg rubber ball is bounced off a wall. Before hitting the
wall, the ball moves...
asked 2 hours ago -
A manufacturing company preparing to build a new plant is
considering three potential locations for it....
asked 2 hours ago -
B. If compound Y has approximately the same values of solubility
in toluene as compound X,...
asked 3 hours ago -
Oscar Inc. has inventory in Japan valued at 39,051,000 Yen one
year ago. One year ago...
asked 3 hours ago -
If Canada suffered from "fundamental disequilibrium," and its
government choose not to devalue its currency, a...
asked 3 hours ago -
4. How many input & output Key Value Pairs are passed into,
and emitted out of...
asked 3 hours ago -
Why would your heart not function well if constructed of
skeletal muscle? What is the particular...
asked 3 hours ago -
Please respond to this essay question in full essay form for
Chemistry 1102 Organic and Biochemistry:...
asked 3 hours ago -
Determine the head loss and velocity of flow in a water supply main
of 15.0 cm...
asked 3 hours ago