-LEAVE ANSWERS OUT TO 4 DECIMAL PLACES - PLEASE SHOW WORK -EACH PART OF EACH QUESTION...
-LEAVE ANSWERS OUT TO 4 DECIMAL PLACES
- PLEASE SHOW WORK
-EACH PART OF EACH QUESTION IS WORTH 2 POINTS FOR A TOTAL OF 38 POINTS.
1. Bank account balance is an example of a variable that follows which scale of measurement?
a. ratio scale
b. interval scale
c. nominal scale
d. ordinal scale
2./The number of lighting deaths per state in the Midwest over 20 years is listed in the table below. We are interested in fully analyzing the number of lighting deaths.
|
State |
# of Lighting Deaths over 20 years |
|
Illinois |
11 |
|
Indiana |
6 |
|
Iowa |
3 |
|
Kansas |
2 |
|
Michigan |
10 |
|
Minnesota |
2 |
|
Missouri |
7 |
|
Nebraska |
4 |
|
North Dakota |
1 |
|
Ohio |
13 |
|
South Dakota |
3 |
|
Wisconsin |
8 |
a. Is this data categorical or quantitative? If quantitative, is it discrete or continuous?
b. Calculate the number of classes and class width.
c. Construct a frequency distribution, including the classes, frequency, and relative frequency.
d. Construct a histogram or bar graph (depending on your answer to part a), including all labels.
e. Calculate the mean, median, and mode.
f. Are the mean, median, and mode descriptive or inferential statistics?
g. Calculate the range.
h. Calculate Q1.
i. Calculate Q3.
j. Calculate the IQR.
k. Find the variance.
l. Find the standard deviation.
m. Find the coefficient of variation.
n. What is the 80th percentile of this data set?
o. Does this data set have any outliers? Use statistics in answering this question (not just your opinion).
p. Would you use the Empirical rule or Chebyshev’s Theorem here and why?
q. Based on the mean and median calculated above, would you expect this data to be symmetric, skewed to the left or skewed to the right and why?
3. A survey of 500 people in Chicago was taken to compare how many are Cubs vs. Sox fans by gender. The cross tabulation is listed below:
|
Gender |
Cubs Fans |
Sox Fans |
Total |
|
Male |
250 |
90 |
340 |
|
Female |
100 |
60 |
160 |
|
Total |
350 |
150 |
500 |
Of the people surveyed who are male, what percentage are Cubs fans?
Homework Answers
Solution1:
Bank account balance is an example of ratio scale of measurement ,in addition to observations having equal intervals,can have a value of zero as well.
2./The number of lighting deaths per state in the Midwest over 20 years is listed in the table below. We are interested in fully analyzing the number of lighting deaths.
we are measuring data it is quantitative. Data does not have integers it is discrete
a. Is this data categorical or quantitative? If quantitative, is it discrete or continuous?
QUANTITATIVE,DISCRETE
b. Calculate the number of classes and class width.
Number of classes=k=1+3.322logn
=1+3.322log12
=4.585
=5
number of classes=5(rounding to next integer , no of classes cannot have decimals)
class width=Range/no of classes
=13-1/5
= 12/5
=2.4
class width=3
| Class interval | Frequency | Relative frequency=frequenc/total |
| 1-3.4 | 5 | 0.416666667 |
| 3.4-5.8 | 1 | 0.083333333 |
| 5.8-8.2 | 3 | 0.25 |
| 8.2-10.6 | 1 | 0.083333333 |
| 10.6-13 | 2 | 0.166666667 |
| Total' | 12 | 1 |
Solution-4:
in excel select the data
go to insert>histogram
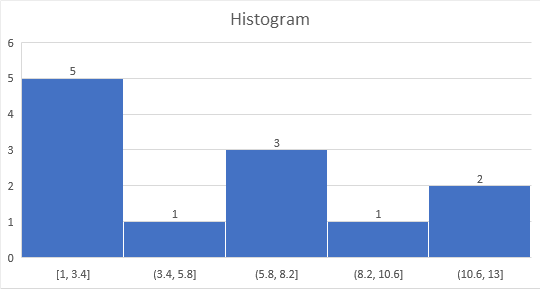
Histogram [1, 3.4] (3.4,5.8] (5.8, 8.2] (8.2, 10.6) (10.6, 13]
Add Answer to:
-LEAVE ANSWERS OUT TO 4 DECIMAL PLACES
- PLEASE SHOW WORK
-EACH PART OF EACH QUESTION...
II. Using the spreadsheet provided, please answer each question. You must show work for the problems...
 II. Using the spreadsheet provided, please answer each question. You must show work for the problems where this is indicated. Round all answers to the nearest hundredth where necessary. 5. Name two categories that have qualitative data. 6. Name two categories that have quantitative data that is discrete, 7. Name two categories that have quantitative data that is continuous. 8. Build a frequency chart for the category “Major". 9. Build a relative frequency chart for the category “Number of Siblings"....
Please provide answers according to question numbers thank you. STAT 160-991 Assignment 1 (based on Handouts...
 Please provide answers according to question numbers thank
you.
STAT 160-991 Assignment 1 (based on Handouts 1 - 8) (1) Which of the following statements applies to this set of data values: 17, 15, 16, 14, 17 18, and 22? (a) The mean, median, and mode are all equal. b) Only the mean and median are equal. (c) Only the mean and mode are equal. (d) Only the median and mode are equal (2) A sample of students who have...
Please provide answers according to question numbers thank
you.
STAT 160-991 Assignment 1 (based on Handouts 1 - 8) (1) Which of the following statements applies to this set of data values: 17, 15, 16, 14, 17 18, and 22? (a) The mean, median, and mode are all equal. b) Only the mean and median are equal. (c) Only the mean and mode are equal. (d) Only the median and mode are equal (2) A sample of students who have...
PO2508 Understanding Statistics EXERCISE SHEET - l. Classify each of the following as nominal, ordinal, interval...
 PO2508 Understanding Statistics EXERCISE SHEET - l. Classify each of the following as nominal, ordinal, interval or ratio level data: a. The telephone area code of interviewees n b. The weight of fish landed at Fraserburgh c. Survey responses that scale attitudes towards a business from 1 to 5 dL d. The time required to sell a house e. Football players shirt numbers Inver f. The Richter scale used to measure earthquake strength g. Job satisfaction ratings of a sample...
Please provide all answers according to question numbers thank you (2) A sample of students who...
 Please provide all answers according to question numbers thank you
(2) A sample of students who have taken a calculus test has a mean score of 78.2, a mode of 67, and a median score of 67. Based on this information, what may one deduce about the distribution of the test scores? (a) It is symmetric. (b) It is right-skewed. (c) It is left-skewed. (d) It is bimodal. (3) What is the set of all simple events of an experiment...
Please provide all answers according to question numbers thank you
(2) A sample of students who have taken a calculus test has a mean score of 78.2, a mode of 67, and a median score of 67. Based on this information, what may one deduce about the distribution of the test scores? (a) It is symmetric. (b) It is right-skewed. (c) It is left-skewed. (d) It is bimodal. (3) What is the set of all simple events of an experiment...
5-8 show work 5. 6. At a local high school 5000 juniors and seniors recently took...
 5-8 show work
5. 6. At a local high school 5000 juniors and seniors recently took an aptitude test. The results of the exam were normally distributed with mean - 450 and o = 50. Calculate the following: a. The PERCENT of students to the nearest tenth of a percent that scored over 425 b. The number of students that scored more than 475 c. The probability of a student selected at random having scored between 400 and 575 A...
5-8 show work
5. 6. At a local high school 5000 juniors and seniors recently took an aptitude test. The results of the exam were normally distributed with mean - 450 and o = 50. Calculate the following: a. The PERCENT of students to the nearest tenth of a percent that scored over 425 b. The number of students that scored more than 475 c. The probability of a student selected at random having scored between 400 and 575 A...
Please do 4 and 5 MAT2572 Probability and Mathematical Statistics Final Exam Name o Show your work. Your answers mus...
 Please do 4 and 5
MAT2572 Probability and Mathematical Statistics Final Exam Name o Show your work. Your answers must be neatly written and logically organized to receive full credit. 1. (10) The tributed with a standard deviation of 400 hours. Suppose that a randotn sample resulted in an average lifetime of 9000 hours. Obtain a 95 percent of the mean lifetime of such a tube. e life of a particular brand of television picture tube is known to be...
Please do 4 and 5
MAT2572 Probability and Mathematical Statistics Final Exam Name o Show your work. Your answers must be neatly written and logically organized to receive full credit. 1. (10) The tributed with a standard deviation of 400 hours. Suppose that a randotn sample resulted in an average lifetime of 9000 hours. Obtain a 95 percent of the mean lifetime of such a tube. e life of a particular brand of television picture tube is known to be...
I literally have no idea what I’m doing. Help!!! Please show work!! Write an essay using...
 I literally have no idea what I’m doing. Help!!! Please show
work!!
Write an essay using Word and post it as an attachment to the discussion. Cover the following points. Choose a data set from Stat Disk using one of the following files from 13th Edition Elementary Statistics: Oscar Winner Freshman 15 Word Count Garbage Weights Passive and Active Smoke If the file contains more than one variable, choose a quantitative variable. Create a histogram using your chosen variable and...
I literally have no idea what I’m doing. Help!!! Please show
work!!
Write an essay using Word and post it as an attachment to the discussion. Cover the following points. Choose a data set from Stat Disk using one of the following files from 13th Edition Elementary Statistics: Oscar Winner Freshman 15 Word Count Garbage Weights Passive and Active Smoke If the file contains more than one variable, choose a quantitative variable. Create a histogram using your chosen variable and...
Please Answer ONLY F1, F2 and G . Thanks Problem: Daycare Management You've been hired as...
 Please Answer ONLY F1, F2 and G .
Thanks
Problem: Daycare Management You've been hired as the Chief Statistician for the SummerlsFun Co. The corporation operates a variety of Summer Children Camp/Daycare chains: ParentsOasis SunAndPlay NoPlaceLikeHome As part of their ongoing marketing effort, SummerIsFun Co. collects a variety of statistics about their members. The database includes the following data (a) Child's age category: infant, toddlers, preschool, pre-K к} (b) Child's BMI category: underweight, normal weight overweight, obese (e) Number of...
Please Answer ONLY F1, F2 and G .
Thanks
Problem: Daycare Management You've been hired as the Chief Statistician for the SummerlsFun Co. The corporation operates a variety of Summer Children Camp/Daycare chains: ParentsOasis SunAndPlay NoPlaceLikeHome As part of their ongoing marketing effort, SummerIsFun Co. collects a variety of statistics about their members. The database includes the following data (a) Child's age category: infant, toddlers, preschool, pre-K к} (b) Child's BMI category: underweight, normal weight overweight, obese (e) Number of...
17 b, 18, and 21 please and show all work. c) Construct a cumulative distribution table...
 17 b, 18, and 21 please and show all work.
c) Construct a cumulative distribution table 17) The following table data are characteristics of voting age population regarding a recent election Males Fem ales Voted 230 370 Did not vote 400 240 a) When a person is chosen at random, find the probability that the person did not vote, given that the person is female b) When a person is chosen at random, find the probability that the person is...
17 b, 18, and 21 please and show all work.
c) Construct a cumulative distribution table 17) The following table data are characteristics of voting age population regarding a recent election Males Fem ales Voted 230 370 Did not vote 400 240 a) When a person is chosen at random, find the probability that the person did not vote, given that the person is female b) When a person is chosen at random, find the probability that the person is...
 II. Using the spreadsheet provided, please answer each question. You must show work for the problems where this is indicated. Round all answers to the nearest hundredth where necessary. 5. Name two categories that have qualitative data. 6. Name two categories that have quantitative data that is discrete, 7. Name two categories that have quantitative data that is continuous. 8. Build a frequency chart for the category “Major". 9. Build a relative frequency chart for the category “Number of Siblings"....
 Please provide answers according to question numbers thank
you.
STAT 160-991 Assignment 1 (based on Handouts 1 - 8) (1) Which of the following statements applies to this set of data values: 17, 15, 16, 14, 17 18, and 22? (a) The mean, median, and mode are all equal. b) Only the mean and median are equal. (c) Only the mean and mode are equal. (d) Only the median and mode are equal (2) A sample of students who have...
Please provide answers according to question numbers thank
you.
STAT 160-991 Assignment 1 (based on Handouts 1 - 8) (1) Which of the following statements applies to this set of data values: 17, 15, 16, 14, 17 18, and 22? (a) The mean, median, and mode are all equal. b) Only the mean and median are equal. (c) Only the mean and mode are equal. (d) Only the median and mode are equal (2) A sample of students who have...
 PO2508 Understanding Statistics EXERCISE SHEET - l. Classify each of the following as nominal, ordinal, interval or ratio level data: a. The telephone area code of interviewees n b. The weight of fish landed at Fraserburgh c. Survey responses that scale attitudes towards a business from 1 to 5 dL d. The time required to sell a house e. Football players shirt numbers Inver f. The Richter scale used to measure earthquake strength g. Job satisfaction ratings of a sample...
 Please provide all answers according to question numbers thank you
(2) A sample of students who have taken a calculus test has a mean score of 78.2, a mode of 67, and a median score of 67. Based on this information, what may one deduce about the distribution of the test scores? (a) It is symmetric. (b) It is right-skewed. (c) It is left-skewed. (d) It is bimodal. (3) What is the set of all simple events of an experiment...
Please provide all answers according to question numbers thank you
(2) A sample of students who have taken a calculus test has a mean score of 78.2, a mode of 67, and a median score of 67. Based on this information, what may one deduce about the distribution of the test scores? (a) It is symmetric. (b) It is right-skewed. (c) It is left-skewed. (d) It is bimodal. (3) What is the set of all simple events of an experiment...
 5-8 show work
5. 6. At a local high school 5000 juniors and seniors recently took an aptitude test. The results of the exam were normally distributed with mean - 450 and o = 50. Calculate the following: a. The PERCENT of students to the nearest tenth of a percent that scored over 425 b. The number of students that scored more than 475 c. The probability of a student selected at random having scored between 400 and 575 A...
5-8 show work
5. 6. At a local high school 5000 juniors and seniors recently took an aptitude test. The results of the exam were normally distributed with mean - 450 and o = 50. Calculate the following: a. The PERCENT of students to the nearest tenth of a percent that scored over 425 b. The number of students that scored more than 475 c. The probability of a student selected at random having scored between 400 and 575 A...
 Please do 4 and 5
MAT2572 Probability and Mathematical Statistics Final Exam Name o Show your work. Your answers must be neatly written and logically organized to receive full credit. 1. (10) The tributed with a standard deviation of 400 hours. Suppose that a randotn sample resulted in an average lifetime of 9000 hours. Obtain a 95 percent of the mean lifetime of such a tube. e life of a particular brand of television picture tube is known to be...
Please do 4 and 5
MAT2572 Probability and Mathematical Statistics Final Exam Name o Show your work. Your answers must be neatly written and logically organized to receive full credit. 1. (10) The tributed with a standard deviation of 400 hours. Suppose that a randotn sample resulted in an average lifetime of 9000 hours. Obtain a 95 percent of the mean lifetime of such a tube. e life of a particular brand of television picture tube is known to be...
 I literally have no idea what I’m doing. Help!!! Please show
work!!
Write an essay using Word and post it as an attachment to the discussion. Cover the following points. Choose a data set from Stat Disk using one of the following files from 13th Edition Elementary Statistics: Oscar Winner Freshman 15 Word Count Garbage Weights Passive and Active Smoke If the file contains more than one variable, choose a quantitative variable. Create a histogram using your chosen variable and...
I literally have no idea what I’m doing. Help!!! Please show
work!!
Write an essay using Word and post it as an attachment to the discussion. Cover the following points. Choose a data set from Stat Disk using one of the following files from 13th Edition Elementary Statistics: Oscar Winner Freshman 15 Word Count Garbage Weights Passive and Active Smoke If the file contains more than one variable, choose a quantitative variable. Create a histogram using your chosen variable and...
 Please Answer ONLY F1, F2 and G .
Thanks
Problem: Daycare Management You've been hired as the Chief Statistician for the SummerlsFun Co. The corporation operates a variety of Summer Children Camp/Daycare chains: ParentsOasis SunAndPlay NoPlaceLikeHome As part of their ongoing marketing effort, SummerIsFun Co. collects a variety of statistics about their members. The database includes the following data (a) Child's age category: infant, toddlers, preschool, pre-K к} (b) Child's BMI category: underweight, normal weight overweight, obese (e) Number of...
Please Answer ONLY F1, F2 and G .
Thanks
Problem: Daycare Management You've been hired as the Chief Statistician for the SummerlsFun Co. The corporation operates a variety of Summer Children Camp/Daycare chains: ParentsOasis SunAndPlay NoPlaceLikeHome As part of their ongoing marketing effort, SummerIsFun Co. collects a variety of statistics about their members. The database includes the following data (a) Child's age category: infant, toddlers, preschool, pre-K к} (b) Child's BMI category: underweight, normal weight overweight, obese (e) Number of...
 17 b, 18, and 21 please and show all work.
c) Construct a cumulative distribution table 17) The following table data are characteristics of voting age population regarding a recent election Males Fem ales Voted 230 370 Did not vote 400 240 a) When a person is chosen at random, find the probability that the person did not vote, given that the person is female b) When a person is chosen at random, find the probability that the person is...
17 b, 18, and 21 please and show all work.
c) Construct a cumulative distribution table 17) The following table data are characteristics of voting age population regarding a recent election Males Fem ales Voted 230 370 Did not vote 400 240 a) When a person is chosen at random, find the probability that the person did not vote, given that the person is female b) When a person is chosen at random, find the probability that the person is...
Most questions answered within 3 hours.
-
ECO
2013 &
asked 1 minute ago -
Insight refers to:
a.
Adaptive decision-making
b.
Credibility and trustworthness
c.
Understanding of one's problems
d....
asked 7 minutes ago -
Explain the differences between rights and permissions within
Windows. Define the principle of least privilege and...
asked 14 minutes ago -
A solid, frictionless cylindrical reel of mass M=5.00kg and
radius R=0.55m is used to draw water...
asked 17 minutes ago -
how do radio waves get emitted from Jupiter?
- do they come from radiation from planet...
asked 17 minutes ago -
The test statistic used in the F test for the equality of two
variances is calculated...
asked 29 minutes ago -
How does neutralisation of IL-6 trans-signaling affect the
autoimmune disease and inflammation? What if the trans-signaling...
asked 19 minutes ago -
f an allele is 'fixed' in a population, what is its
frequency?
0.50
0.75
0.25
0...
asked 33 minutes ago -
Do we have a duty of national loyalty in business? What is the
major argument in...
asked 34 minutes ago -
compare the international treatment of segment reporting to the
us gaap treatment
asked 30 minutes ago -
A statistics student finds herself struggling with a newspaper
article stating that only eighteen percent of...
asked 1 hour ago -
People with beriberi, a disease caused by a thiamin deficiency,
have elevated levels of blood pyruvate...
asked 50 minutes ago