Construct the confidence interval for the population variance for the given values. Round your answers to...
Construct the confidence interval for the population variance for the given values. Round your answers to one decimal place.
n=14, s2=13.1, and c=0.8
Homework Answers
We have given here,
Sample variance =13.1
Sample size =14
Degree of freedom =n-1= 13
Level of significance given =1-0.80=0.2
Chi square critical value for lower tail=7.042
Chi square critical value for upper tail=19.812
We can use here confidence interval formula for population
variance

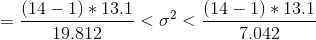
=(8.6,24.2)
Lower confidence limit for population variance=8.6
Upper confidence limit for population variance =24.2
Add Answer to:
Construct the
confidence interval for the population variance for the given
values. Round your answers to...
Construct the confidence interval for the population variance for the given values. Round your answers to...
Construct the confidence interval for the population variance for the given values. Round your answers to one decimal place. n=25, s2=38.3, and c=0.95
Construct the confidence interval for the population variance for the given values. Round your answers to...
Construct the confidence interval for the population variance for the given values. Round your answers to one decimal place. n=27, s^2 =10.5 and c=0.9
Construct the confidence interval for the population standard deviation for the given values. Round your answers...
Construct the confidence interval for the population standard deviation for the given values. Round your answers to one decimal place. n=23, s=9.9, and c=0.95 Could someone help teach me the formula to solve this in Excel! Thanks so much!
Determine the critical values for the confidence interval for the population variance from the given values....
Determine the critical values for the confidence interval for the population variance from the given values. Round your answers to three decimal places. n = 13 and α = 0.05 Answer: blank and blank
Find the critical values x?and XR for the given confidence level c and sample size n....
 Find the critical values x?and XR for the given confidence level c and sample size n. C=0.8, n=30 xL= (Round to three decimal places as needed.) Find the critical values x and x for the given confidence level c and sample size n. c=0.9, n=21 x?L= (Round to three decimal places as needed.) Use technology to construct the confidence intervals for the population variance o2 and the population standard deviation o. Assume the sample is taken from a normally distributed...
Find a 90% confidence interval for a population mean μ for these values. (Round your answers...
Find a 90% confidence interval for a population mean μ for these values. (Round your answers to three decimal places.) (a) n = 105, x = 0.81, s2 = 0.089 (b) n = 90, x = 21.3, s2 = 3.53 (c) Interpret the intervals found in part (a) and part (b): A. There is a 10% chance that an individual sample proportion will fall within the interval. B. In repeated sampling, 90% of all intervals constructed in this manner will...
Construct the indicated confidence interval for the population mean μ using the t distribution. Assume the...
 Construct the indicated confidence interval for the population mean μ using the t distribution. Assume the population is normally distributed c:0.98, x=13.1, s:0 82, n; 13 Round to one decimal place as needed)
In order to construct a confidence interval for the population variance, a random sample of n...
 In order to construct a confidence interval for the population variance, a random sample of n observations is drawn from a normal population. Use this information to find χ2a/2, df and χ21 L 2, df under the following scenarios. (Round your answers to 3 decimal places. You may find it useful to reference the appropriate table: chi-square table or Ftable) a/2,d.f X"1-a/2,df a. A 90% confidence level with n- 17. b. A 90% confidence level with n- 28. C. A...
In order to construct a confidence interval for the population variance, a random sample of n...
In order to construct a confidence interval for the population variance, a random sample of n observations is drawn from a normal population. Use this information to find χ2α/2,df and χ21-α/2,df under the following scenarios. (Round your answers to 3 decimal places. You may find it useful to reference the appropriate table: chi-square table or F table) χ2α/2,df χ21-α/2,df a. A 90% confidence level with n = 25. b. A 90% confidence level with n = 35. c. A 99%...
Construct a confidence interval of the population proportion at the given level of confidence. x- 120,...
 Construct a confidence interval of the population proportion at the given level of confidence. x- 120, n 1200, 99% confidence The lower bound of the confidence interval is (Round to three decimal places as needed.) The upper bound of the confidence interval is (Round to three decimal places as needed.) Construct a 99% confidence interval of the population proportion using the given information. X 105, n 150 The lower bound is The upper bound is (Round to three decimal places...
 Find the critical values x?and XR for the given confidence level c and sample size n. C=0.8, n=30 xL= (Round to three decimal places as needed.) Find the critical values x and x for the given confidence level c and sample size n. c=0.9, n=21 x?L= (Round to three decimal places as needed.) Use technology to construct the confidence intervals for the population variance o2 and the population standard deviation o. Assume the sample is taken from a normally distributed...
 Construct the indicated confidence interval for the population mean μ using the t distribution. Assume the population is normally distributed c:0.98, x=13.1, s:0 82, n; 13 Round to one decimal place as needed)
 In order to construct a confidence interval for the population variance, a random sample of n observations is drawn from a normal population. Use this information to find χ2a/2, df and χ21 L 2, df under the following scenarios. (Round your answers to 3 decimal places. You may find it useful to reference the appropriate table: chi-square table or Ftable) a/2,d.f X"1-a/2,df a. A 90% confidence level with n- 17. b. A 90% confidence level with n- 28. C. A...
 Construct a confidence interval of the population proportion at the given level of confidence. x- 120, n 1200, 99% confidence The lower bound of the confidence interval is (Round to three decimal places as needed.) The upper bound of the confidence interval is (Round to three decimal places as needed.) Construct a 99% confidence interval of the population proportion using the given information. X 105, n 150 The lower bound is The upper bound is (Round to three decimal places...
Most questions answered within 3 hours.
-
You look at yourself in a shiny 9.6-cm-diameter Christmas tree
ball.
If your face is 21.0...
asked 48 seconds ago -
If we were to measure the relaxation time of a muscle after
undergoing tetanus compared to...
asked 30 seconds ago -
4CO(g) + 8H2(g) -----> 3CH4(g) +
CO2(g) + 2H2O(l)
Use the following data as needed to...
asked 3 minutes ago -
without using map
1. Write a C++ program to find out the top 10 words in...
asked 17 minutes ago -
1)Calculate the percent ionization of a
0.330 M solution of hypochlorous
acid.
% Ionization = %...
asked 19 minutes ago -
1a) How many grams of K2SO4 are in 250mL
of 0.11 M K2SO4 solution?
_____ g...
asked 10 minutes ago -
The vapor pressure of a solution containing 38.7 g glycerin
(C3H8O3) in 146.2 g ethanol (C2H5OH)...
asked 15 minutes ago -
A physics major is cooking breakfast when he notices that the
frictional force between the steel...
asked 20 minutes ago -
A cyclohexane (c-hex) solution is prepared by fully dissolving
9.11g of a newly synthesized organic compound...
asked 26 minutes ago -
SCHEME :-)
[5 marks] Write a procedure called convert that takes as
arguments: a temperature value...
asked 33 minutes ago -
Are
Acetyl CoA and Pyruvate biological molecules that are used to get
ATP energy in aerobic...
asked 34 minutes ago -
Two waves are traveling on a string, one with a wave function,
y1 = 0.05sin(4x -...
asked 41 minutes ago