Consider three six-sided dice, and let random variable Y = the value of the face for...
Consider three six-sided dice, and let random variable Y = the value of the face for each. The probability mass of function of Y is given by the following table:
|
y |
1 |
2 |
3 |
4 |
5 |
6 |
otherwise |
|
P(Y=y) |
0.35 |
0.30 |
0.25 |
0.05 |
0.03 |
0.02 |
0 |
- Roll the three dice and let random variable X = sum of the three faces. Repeat this experiment 50000 times.
- Find the simulated probability mass function (pmf) of random variable X.
- Find the simulated mean of the random variable X.
- Find the simulated standard deviation of random variable X.
- Find the simulated P(2 < X < 13).
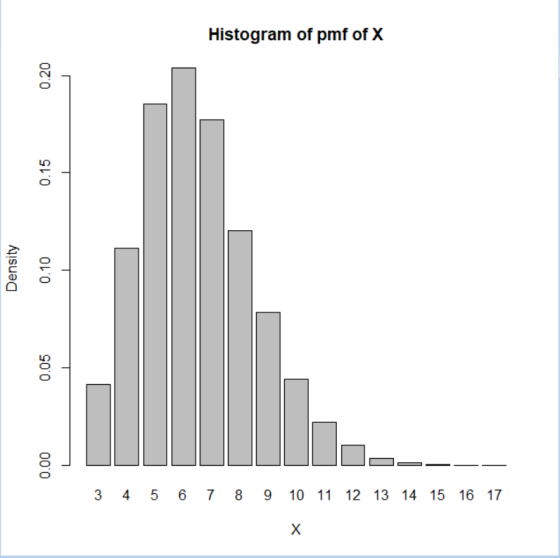
- Draw the histogram of the pmf of X.
- Generate 2000 samples of size 50000 values for the random X from distribution in part1. For each of these 2000 samples calculate the mean of X.
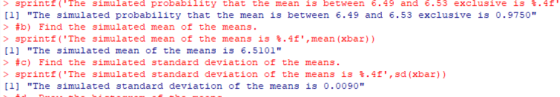
- Find the simulated probability that the mean is between 6.49 and 6.53 exclusive.
- Find the simulated mean of the means.
- Find the simulated standard deviation of the means.
- Draw the histogram of the means.
Homework Answers
R code with comments (all statements starting with # are comments)
#part 1
set.seed(123)
#set the number of experiments
N<-50000
#set the probabilities of Y
py<-c(0.35,0.30,0.25,0.05,0.03,0.02)
#sample 3 Ys N times
y<-sample(1:6,size=3*N,prob=py,replace=TRUE)
#convert y to a matrix of N rows and 3 columns
#(indicating the roll of 3 dice, N times)
y<-matrix(y,nrow=N,ncol=3)
#sum each row to get N, Xs
x<-apply(y,1,sum)
#A. Find the simulated probability mass function (pmf) of random
variable X.
#get unique values of X
X<-sort(unique(x))
#initialize the variable pmf
pmfx<-numeric(length(X))
#calculate the pmf
for (i in 1:length(X)){
pmfx[i]<-sum(x==X[i])/N
}
print(data.frame(X,pmfx))
#B.Find the simulated mean of the random variable X.
sprintf('The simulated mean of X is %.4f',mean(x))
#C. Find the simulated standard deviation of random variable
X.
sprintf('The simulated standard deviation of X is
%.4f',sd(x))
#D. Find the simulated P(2 < X < 13).
sprintf('The simulated P(2 < X < 13)is
%.4f',sum(2<x&x<13)/N)
#E. Draw the histogram of the pmf of X.
barplot(pmfx,names=X,main="Histogram of pmf of
X",xlab="X",ylab="Density")
# get this output

get this plot
part 2)
R code
#Generate 2000 samples of size 50000 values
#for the random X from distribution in part1.
set.seed(123)
R<-2000
xbar<-numeric(R)
for (i in 1:R) {
#sample 3 Ys N times
y<-sample(1:6,size=3*N,prob=py,replace=TRUE)
#convert y to a matrix of N rows and 3 columns
#(indicating the roll of 3 dice, N times)
y<-matrix(y,nrow=N,ncol=3)
#sum each row to get N, Xs
x<-apply(y,1,sum)
#get the mean
xbar[i]<-mean(x)
}
#a) the simulated probability that the mean is between 6.49 and
6.53 exclusive
sprintf('The simulated probability that the mean is between 6.49
and 6.53 exclusive is
%.4f',sum(6.49<xbar&xbar<6.53)/R)
#b) Find the simulated mean of the means.
sprintf('The simulated mean of the means is %.4f',mean(xbar))
#c) Find the simulated standard deviation of the means.
sprintf('The simulated standard deviation of the means is
%.4f',sd(xbar))
#d. Draw the histogram of the means.
hist(xbar,main="Histogram of means",xlab="Means")
#get this output
get this plot
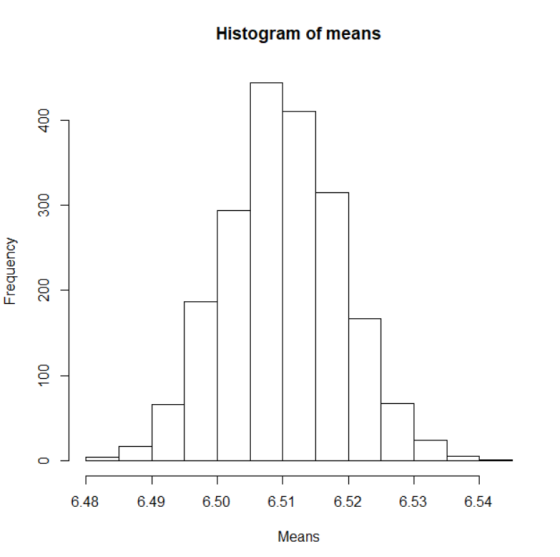
As predicted by the CLT, the histogram of means is normally distributed (bell shape), even though the population (the distribution of X from part 1) is not normally distributed.
Add Answer to:
Consider three six-sided dice, and let random variable Y = the
value of the face for...
Write a Code in Java or Python, for the following scenario(s): Consider three six-sided dice, and...
Write a Code in Java or Python, for the following scenario(s): Consider three six-sided dice, and let random variable Y = the value of the face for each. The probability mass of function of Y is given by the following table: y 1 2 3 4 5 6 otherwise P(Y=y) 0.35 0.30 0.25 0.05 0.03 0.02 0 Roll the three dice and let random variable X = sum of the three faces. Repeat this experiment 50000 times. Find the simulated...
Roll two fair four-sided dice. Let X and Y be the die scores from the 1st...
Roll two fair four-sided dice. Let X and Y be the die scores from the 1st die and the 2nd die, respectively, and define a random variable Z = X − Y (a) Find the pmf of Z. (b) Draw the histogram of the pmf of Z. (c) Find P{Z < 0}. (d) Are the events {Z < 0} and {Z is odd} independent? Why?
A fair tetrahedron (four-sided die) is rolled twice. Let X be the random variable denoting the...
A fair tetrahedron (four-sided die) is rolled twice. Let X be the random variable denoting the total number of dots in the outcomes, and Y be the random variable denoting the maximum in the two outcomes. Thus if the outcome is a (2, 3) then X = 5 while Y = 3. (a) What are the ranges of X and Y ? (b) Find the probability mass function (PMF) of X and present it graphically. Describe the shape of this...
You roll a pair of standard six–sided dice and record the largest of the two outcomes....
You roll a pair of standard six–sided dice and record the largest of the two outcomes. Let X be random variable associated with the outcome of this experiment. (b) What is the probability mass function (PMF) of X? (c) What is the cumulative distribution function (CDF) of X?
Two four-sided dice, one red and one white, will be rolled. List the possible values for the following random variable. Let Y = difference between the number on the red die and the number on the white...
Two four-sided dice, one red and one white, will be rolled. List the possible values for the following random variable. Let Y = difference between the number on the red die and the number on the white die (red-white). a. Draw the probability histogram for this random variable. b. What is the most likely value of Y? c. What is the probability that the difference on the dice is negative? Use proper notation throughout. Write your answer as a decimal.
(4) Consider rolling three dice. Let X1, X2, and X3 the values which appear on the three dice, respectively. Let Y be the maximum out of all three dice. (a) Find the conditional PMF py)xi (yr) (b) Fi...
 (4) Consider rolling three dice. Let X1, X2, and X3 the values which appear on the three dice, respectively. Let Y be the maximum out of all three dice. (a) Find the conditional PMF py)xi (yr) (b) Find the probability that the maximum of all three dice is 4 given that the first die is a 3. (c) Find the probability that the maximum of all three dice is 3 given that the first die is a 3
(4) Consider...
(4) Consider rolling three dice. Let X1, X2, and X3 the values which appear on the three dice, respectively. Let Y be the maximum out of all three dice. (a) Find the conditional PMF py)xi (yr) (b) Find the probability that the maximum of all three dice is 4 given that the first die is a 3. (c) Find the probability that the maximum of all three dice is 3 given that the first die is a 3
(4) Consider...
Problem 1. Let X be a discrete random variable with values -2,0,1,5 urith pmf (a) Verify...
 Problem 1. Let X be a discrete random variable with values -2,0,1,5 urith pmf (a) Verify that the probabilities do define a pmf (probability mass function) ( b) Compute the mean of X , i.e., μ -E(X) (c) Compute the standard deviation of X, i.e., σ- Nar(X)
Part I - Throwing a Dice with Six Faces (32 points) Consider a dice with six...
 Part I - Throwing a Dice with Six Faces (32 points) Consider a dice with six faces, i.e. a standard dice. The possible outcomes after throwing the dice once are 1, 2,3, 4,5,6 (a) Assume that the dice is thrown once. Let w represents the outcome. Explain why P(w-i) for i = i..6, when the dice is fair (b) The fair dice is thrown twice. Find the probability of occurance of at least one 6 The fair dice is thrown...
Let a random variable X be uniformly distributed between −1 and 2. Let another random variable...
Let a random variable X be uniformly distributed between −1 and 2. Let another random variable Y be normally distributed with mean −8 and standard deviation 3. Also, let V = 22+X and W = 13+X −2Y . (a) Is X discrete or continuous? Draw and explain. (b) Is Y discrete or continuous? Draw and explain. (c) Find the following probabilities. (i) The probability that X is less than 2. (ii) P(X > 0) (iii) P(Y > −11) (iv) P...
 (4) Consider rolling three dice. Let X1, X2, and X3 the values which appear on the three dice, respectively. Let Y be the maximum out of all three dice. (a) Find the conditional PMF py)xi (yr) (b) Find the probability that the maximum of all three dice is 4 given that the first die is a 3. (c) Find the probability that the maximum of all three dice is 3 given that the first die is a 3
(4) Consider...
(4) Consider rolling three dice. Let X1, X2, and X3 the values which appear on the three dice, respectively. Let Y be the maximum out of all three dice. (a) Find the conditional PMF py)xi (yr) (b) Find the probability that the maximum of all three dice is 4 given that the first die is a 3. (c) Find the probability that the maximum of all three dice is 3 given that the first die is a 3
(4) Consider...
 Problem 1. Let X be a discrete random variable with values -2,0,1,5 urith pmf (a) Verify that the probabilities do define a pmf (probability mass function) ( b) Compute the mean of X , i.e., μ -E(X) (c) Compute the standard deviation of X, i.e., σ- Nar(X)
 Part I - Throwing a Dice with Six Faces (32 points) Consider a dice with six faces, i.e. a standard dice. The possible outcomes after throwing the dice once are 1, 2,3, 4,5,6 (a) Assume that the dice is thrown once. Let w represents the outcome. Explain why P(w-i) for i = i..6, when the dice is fair (b) The fair dice is thrown twice. Find the probability of occurance of at least one 6 The fair dice is thrown...
Most questions answered within 3 hours.
-
You and your opponent both roll a fair die. If you both roll the
same number,...
asked 8 minutes ago -
In a study of the accuracy of fast food drive-through orders,
Restaurant A had 257 accurate...
asked 8 minutes ago -
Identify and describe in detail the four categories of
institutions that could be included in a...
asked 14 minutes ago -
In python
class Customer:
def __init__(self, customer_id, last_name, first_name, phone_number, address):
self._customer_id = int(customer_id)
self._last_name =...
asked 22 minutes ago -
What is an example of a limitation in implementing a new
ERP system and how it...
asked 17 minutes ago -
In a section of 9.7cm of an artery with a radius of 2.6mm there
is a...
asked 18 minutes ago -
the two carboxylic acid groups of aspartic acid have different
acidities with pKa values of 2.1...
asked 22 minutes ago -
Would CuCO3 aqueous salt combined with calcium chloride
form a solid precipitate? If so, what would...
asked 20 minutes ago -
How do ECM Solutions assist in embedding a culture of continuous
improvement in an organization? (Project...
asked 41 minutes ago -
Directions
These directions introduce the idea of Essential Questions.
Since this may be a new concept...
asked 43 minutes ago -
1.b. Fiscal policy is said to suffer from ‘crowding out’.
Explain what this means and why...
asked 1 hour ago -
The equation for the reaction of nitrogen and oxygen to form
nitrogen oxide is written as...
asked 1 hour ago