
Homework Answers


The excel output is attached here for more illustrations.
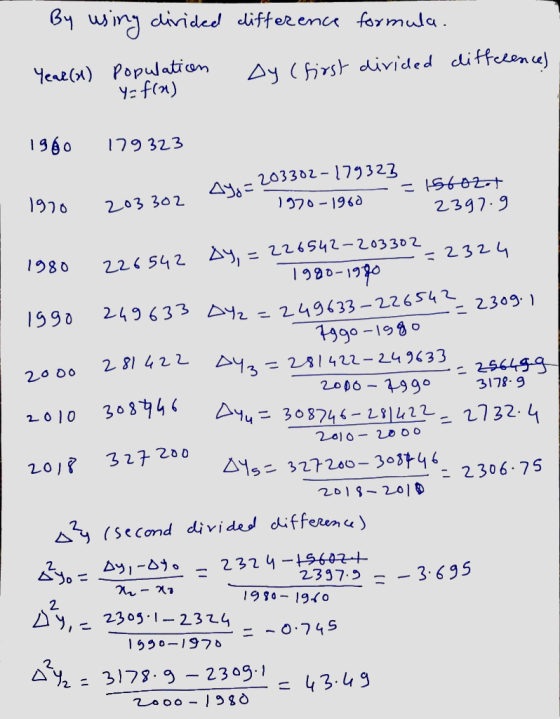
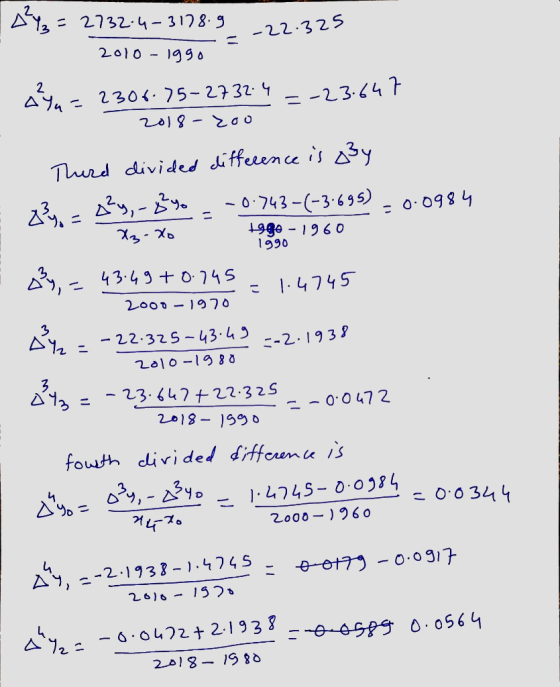
x y 1st d 2nd 3rd 4th 5th 6th
1960 179323 2397.9 -3.695 0.098333333 0.034404167 -0.00252225 0.0000965
1970 203302 2324 -0.745 1.4745 -0.091708333 0.00308746
1980 226542 2309.1 43.49 -2.193833333 0.056489766
1990 249633 3178.9 -22.325 -0.047222222
2000 281422 2732.4 -23.64722222
2010 308746 2306.75
2018 327200
Add Answer to:
5. 120 pointsy A census of the population of the United States is taken every 10 years. The follo...
please dont use any program while solving it, but if you want to use maple, thats...
 please dont use any program while solving it, but if you want
to use maple, thats fine.
The following table lists the population of the United States from 1960 to 2010. Year 1960 1970 1980 1990 2000 2010 Population (thousands) OD 179,323 to 203,302 226,542 249,633 281,442 307,746 a. Find the Lagrange polynomial of degree 5 fitting this data and use this polynomial to estimate the population in the years 1950, 1975, and 2020. b. The population in 1950 was...
please dont use any program while solving it, but if you want
to use maple, thats fine.
The following table lists the population of the United States from 1960 to 2010. Year 1960 1970 1980 1990 2000 2010 Population (thousands) OD 179,323 to 203,302 226,542 249,633 281,442 307,746 a. Find the Lagrange polynomial of degree 5 fitting this data and use this polynomial to estimate the population in the years 1950, 1975, and 2020. b. The population in 1950 was...
THis is r。 The data (uspop) gives the decade-by-decade population of the United States (in millions)...
THis is r。 The data (uspop) gives the decade-by-decade population of the United States (in millions) as recorded by the decennial census for the period 1790–1970. Load the data. 1. Use names() and seq() to add the years 1790 – 1970 to the data vector. 2. Obtain the inter-decade differences. Which decade had the largest increase in US population?
Use it and Excel to answer this question. It contains the United States Census Bureau’s estimates...
Use it and Excel to answer this question. It contains the United States Census Bureau’s estimates for World Population from 1950 to 2014. You will find a column of dates and a column of data on the World Population for these years. Generate the time variable t. Then run a regression with the Population data as a dependent variable and time as the dependent variable. Have Excel report the residuals. (a) (4 marks) Based on the ANOVA table and t-statistics,...
2 Understanding and Calculating Inflation Real and Nominal Interest Rates in the United States, 1960-2015 Percent...
 2 Understanding and Calculating Inflation Real and Nominal Interest Rates in the United States, 1960-2015 Percent 16 14 Nominal Real 1960 1965 1970 1975 1980 1985 1990 1995 2000 2005 2010 2015 Year Figure 2: Real and nominal interest rates in the US, 1960-2015 1. State the Fisher equation. What do the three variables in Fisher's equation represent? 2. Consider Figure 2. Why do negative real interest rates occur? Are they a problem for the economy? 3. In Figure 2,...
Styles The data in the accompanying table represent the population of a certain country every 10 ...
 Styles The data in the accompanying table represent the population of a certain country every 10 years for the years 1900-2000. An ecologist is interested in finding an equation that describes the population of the country over time. Complete parts (a) through (3) below Year, x 1900 1910 1920 1930 1940 1950 Population, y Year, x Population, y 179,323 203,302 79,212 1960 95,228 1970 104,021 1980 123,202 1990 132,164 2000 151,325 226,542 248,709 281,421 (a)Determine the least-squares regression equation, treating...
Unit Project: Population Analysis
 Read the Overview and look at the Sample Project to understand what you will be creating. Check out the Rubric to make sure you earn every possible point. Use the Presentation Template to create the presentation you will submit. Use the spreadsheet template to organize your data and create your scatter plots.All of the files can be found in this Google Drive folder. The files are Microsoft Office files. You can download them to use with MS Office or you...
Unit Project: Population Analysis
Read the Overview and look at the Sample Project to understand what you will be creating. Check out the Rubric to make sure you earn every possible point. Use the Presentation Template to create the presentation you will submit. Use the spreadsheet template to organize your data and create your scatter plots.All of the files can be found in this Google Drive folder. The files are Microsoft Office files. You can download them to use with MS Office or you...
3-The population in the city of Houston from 1900 to 2010 is given below: Year Population...
3-The population in the city of Houston from 1900 to 2010 is given below: Year Population 1900 44,633 1910 78,800 1920 138,276 1930 292,352 1940 384,514 1950 596,163 1960 938,219 1970 1,233,505 1980 1,595,138 1990 1,631,766 2000 1,953,631 2010 2,100,263 a. Give a scatter-plot and residual plot of the data. b. Based on the graphs in part a, propose a model for the data. Show me evidence to support your conclusion. Go through all necessary steps to construct a model...
The distribution of ages of females in the United States is strongly skewed to the left with a mean of 80.2 years. A random sample of n 20 females is taken from this population and the mean ag...
 The distribution of ages of females in the United States is strongly skewed to the left with a mean of 80.2 years. A random sample of n 20 females is taken from this population and the mean age of the sample is calculated. This is repeated 500 times. Which one of the following best describes the shape of the sampling distribution? 20. Cannot be determined because the standard deviation is unknown. Skewed to the left with a mean of (A)...
the language is in Python please help Instructions from your teacher. Instructions The US Population.txt file...
 the language is in Python please help
Instructions from your teacher. Instructions The US Population.txt file contains the midyear population of United States, in thousands, during the years 1950 through 1990. The first line in the file contains the population for 1950, the second line contains the population for 1951, and so forth. Create an application that reads the file's contents into a list. The application should do the following: • (15 points) Read the file into an list of...
the language is in Python please help
Instructions from your teacher. Instructions The US Population.txt file contains the midyear population of United States, in thousands, during the years 1950 through 1990. The first line in the file contains the population for 1950, the second line contains the population for 1951, and so forth. Create an application that reads the file's contents into a list. The application should do the following: • (15 points) Read the file into an list of...
 please dont use any program while solving it, but if you want
to use maple, thats fine.
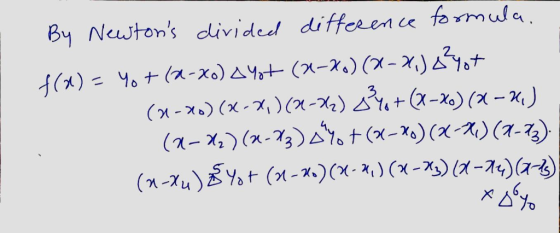
The following table lists the population of the United States from 1960 to 2010. Year 1960 1970 1980 1990 2000 2010 Population (thousands) OD 179,323 to 203,302 226,542 249,633 281,442 307,746 a. Find the Lagrange polynomial of degree 5 fitting this data and use this polynomial to estimate the population in the years 1950, 1975, and 2020. b. The population in 1950 was...
please dont use any program while solving it, but if you want
to use maple, thats fine.
The following table lists the population of the United States from 1960 to 2010. Year 1960 1970 1980 1990 2000 2010 Population (thousands) OD 179,323 to 203,302 226,542 249,633 281,442 307,746 a. Find the Lagrange polynomial of degree 5 fitting this data and use this polynomial to estimate the population in the years 1950, 1975, and 2020. b. The population in 1950 was...
 2 Understanding and Calculating Inflation Real and Nominal Interest Rates in the United States, 1960-2015 Percent 16 14 Nominal Real 1960 1965 1970 1975 1980 1985 1990 1995 2000 2005 2010 2015 Year Figure 2: Real and nominal interest rates in the US, 1960-2015 1. State the Fisher equation. What do the three variables in Fisher's equation represent? 2. Consider Figure 2. Why do negative real interest rates occur? Are they a problem for the economy? 3. In Figure 2,...
 Styles The data in the accompanying table represent the population of a certain country every 10 years for the years 1900-2000. An ecologist is interested in finding an equation that describes the population of the country over time. Complete parts (a) through (3) below Year, x 1900 1910 1920 1930 1940 1950 Population, y Year, x Population, y 179,323 203,302 79,212 1960 95,228 1970 104,021 1980 123,202 1990 132,164 2000 151,325 226,542 248,709 281,421 (a)Determine the least-squares regression equation, treating...
 The distribution of ages of females in the United States is strongly skewed to the left with a mean of 80.2 years. A random sample of n 20 females is taken from this population and the mean age of the sample is calculated. This is repeated 500 times. Which one of the following best describes the shape of the sampling distribution? 20. Cannot be determined because the standard deviation is unknown. Skewed to the left with a mean of (A)...
 the language is in Python please help
Instructions from your teacher. Instructions The US Population.txt file contains the midyear population of United States, in thousands, during the years 1950 through 1990. The first line in the file contains the population for 1950, the second line contains the population for 1951, and so forth. Create an application that reads the file's contents into a list. The application should do the following: • (15 points) Read the file into an list of...
the language is in Python please help
Instructions from your teacher. Instructions The US Population.txt file contains the midyear population of United States, in thousands, during the years 1950 through 1990. The first line in the file contains the population for 1950, the second line contains the population for 1951, and so forth. Create an application that reads the file's contents into a list. The application should do the following: • (15 points) Read the file into an list of...
Most questions answered within 3 hours.
-
Why [M(CN)6] is not organometallic even it has metal
to carbon bond too
asked 45 seconds ago -
mstar electric has a bond issue outstanding that has a 20 year
life, a $1,000 par...
asked 8 minutes ago -
This is a Business Writing Question:
Common Types of Faulty Sentence Logic:
A. Mixed constructions
B....
asked 8 minutes ago -
Skinner asserts that science, and the common view of science, has
been tarnished. Explain his evidence...
asked 11 minutes ago -
Question 3 (1 point)
Fill in the blank. Speed Car Rental company found that the tire...
asked 12 minutes ago -
An short-seller in Tesla is worried the latest management
earnings forecast is too aggressive and the...
asked 12 minutes ago -
A grocery store's receipts show that Sunday customer purchases
have a skewed distribution with a mean...
asked 18 minutes ago -
A 0.035 mol sample of a weak acid, HA, is dissolved in 437 mL of
water...
asked 29 minutes ago -
a sample of Ar gas has a volume of 6.30 L with an unknown
pressure. the...
asked 30 minutes ago -
The
serum cholesterol levels of a population of kids follow a normal
distribution with mean 155...
asked 50 minutes ago -
han discusses the racist practice of badlands, a bar
in the Castro
district of San Francisco,...
asked 1 hour ago -
A sample of final exam scores is normally distributed with a
mean equal to 25 and...
asked 1 hour ago