
Homework Answers
a)
t = Coefficient / Error
p-value = TDIST(t,n-1,2)
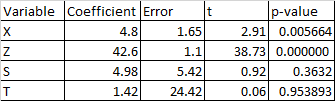
From the above table, p-value for X and Z is less than 0.05. Hence at 5% significance level, X and Z are significant variables.
b)
Null and Alternate Hypothesis
H0: β1 = β2 = 0
Ha: β1 <> 0 or β2 <> 0
Test Statistic

Where,
SSRr is the sum of the squared residuals of the restricted model = 500
SSRur is the sum of the squared residuals for unrestricted model = 400
n = 45
k is the number of independent variables in the unrestricted model = 4
q is the number of restrictions (or the number of coefficients being jointly tested) = 2
Hence, F = {(500-400)/2}/{400/(45-4-1} = 5
Alpha = 0.05
FCritical (q,n-k-1) = 3.23
Result
Since our F is greater than FCritical we reject the null hypothesis.
Conclusion
Removing X and Z from the Model affects the residuals.
Add Answer to:
2. An econometrician estimates the following two equations: = 2.4 + 4.8 X‘ + 42.6 Z. + 4.98 Si + ...
15. {Exercise 12.23 (Algorithmic)} Given are five observations for two variables, x and y. xi 1...
15. {Exercise 12.23 (Algorithmic)} Given are five observations for two variables, x and y. xi 1 2 3 4 5 yi 3 8 6 12 14 The estimated regression equation is ŷ = 0.8 + 2.6x. Compute the mean square error using the following equation (to 3 decimals). Compute the standard error of the estimate using the following equation (to 3 decimals). Compute the estimated standard deviation b1 using the following equation (to 3 decimals). Use the t test to...
The following ANOVA model is for a multiple regression model with two independent variables: Degrees of Sum of Mean Source Freedom Squares ...
 The following ANOVA model is for a multiple regression model
with two independent variables:
Degrees
of
Sum
of
Mean
Source
Freedom
Squares
Squares
F
Regression
2
60
Error
18
120
Total
20
180
Determine the Regression Mean Square (MSR):
Determine the Mean Square Error (MSE):
Compute the overall Fstat test statistic.
Is the Fstat significant at the 0.05 level?
A linear regression was run on auto sales relative to consumer
income. The Regression Sum of Squares (SSR) was 360 and...
The following ANOVA model is for a multiple regression model
with two independent variables:
Degrees
of
Sum
of
Mean
Source
Freedom
Squares
Squares
F
Regression
2
60
Error
18
120
Total
20
180
Determine the Regression Mean Square (MSR):
Determine the Mean Square Error (MSE):
Compute the overall Fstat test statistic.
Is the Fstat significant at the 0.05 level?
A linear regression was run on auto sales relative to consumer
income. The Regression Sum of Squares (SSR) was 360 and...
Part a) Compute the regression line for these data, and provide your estimates of the slope...
 Part a)
Compute the regression line for these data, and provide your
estimates of the slope and intercept parameters. Please round
intermediate results to 6 decimal places.
Slope:
Intercept:
Note: For sub-parts below, use the slope and intercept
values in Part a, corrected to 3 decimal places to calculate
answers by hand using a scientific calculator.
Part b)
Based on the regression model, what level of horsepower would you
expect the engine to produce if running at 24002400 rpm?
Answer:...
Part a)
Compute the regression line for these data, and provide your
estimates of the slope and intercept parameters. Please round
intermediate results to 6 decimal places.
Slope:
Intercept:
Note: For sub-parts below, use the slope and intercept
values in Part a, corrected to 3 decimal places to calculate
answers by hand using a scientific calculator.
Part b)
Based on the regression model, what level of horsepower would you
expect the engine to produce if running at 24002400 rpm?
Answer:...
(I did this homework in completion but professor was not happy with answers whatsoever, need additional...
 (I did this homework in completion but professor was
not happy with answers whatsoever, need additional answers and
especially improvement to 1.b
help!! photos not attaching?
mean by severai steps. inis is a View Feedback homework and will need you to work, in one two View Feedback or various steps. Unfortunately, I cannot read your screen shot of what you did on excel. As I have said in numerous messages announcements etc, I cannot аcсept pictures. You need to write...
(I did this homework in completion but professor was
not happy with answers whatsoever, need additional answers and
especially improvement to 1.b
help!! photos not attaching?
mean by severai steps. inis is a View Feedback homework and will need you to work, in one two View Feedback or various steps. Unfortunately, I cannot read your screen shot of what you did on excel. As I have said in numerous messages announcements etc, I cannot аcсept pictures. You need to write...
Gain (V/V) R Setting Totals Averages Sample 1 Sample 2 Sample 3 4 ап 7.8 8.1...
 Gain (V/V) R Setting Totals Averages Sample 1 Sample 2 Sample 3 4 ап 7.8 8.1 7.9 3 5.2 6.0 4.3 = 359.3 i=1 j=1 2 4.4 6.9 3.8 1 2.0 1.7 0.8 This is actual data from one of Joe Tritschler's audio engineering experiments. Use Analysis of Variance (ANOVA) to test the null hypothesis that the treatment means are equal at the a = 0.05 level of significance. Fill in the ANOVA table. Source of Variation Sum of Squares...
All of the following questions are in relation to the following journal article which is available...
 All of the following questions are in relation to the following journal article which is available on Moodle: Parr CL, Magnus MC, Karlstad O, Holvik K, Lund-Blix NA, Jaugen M, et al. Vitamin A and D intake in pregnancy, infant supplementation and asthma development: the Norwegian Mother and Child Cohort. Am J Clin Nutr 2018:107:789-798 QUESTIONS: 1. State one hypothesis the author's proposed in the manuscript. 2. There is previous research that shows that adequate Vitamin A intake is required...
 The following ANOVA model is for a multiple regression model
with two independent variables:
Degrees
of
Sum
of
Mean
Source
Freedom
Squares
Squares
F
Regression
2
60
Error
18
120
Total
20
180
Determine the Regression Mean Square (MSR):
Determine the Mean Square Error (MSE):
Compute the overall Fstat test statistic.
Is the Fstat significant at the 0.05 level?
A linear regression was run on auto sales relative to consumer
income. The Regression Sum of Squares (SSR) was 360 and...
The following ANOVA model is for a multiple regression model
with two independent variables:
Degrees
of
Sum
of
Mean
Source
Freedom
Squares
Squares
F
Regression
2
60
Error
18
120
Total
20
180
Determine the Regression Mean Square (MSR):
Determine the Mean Square Error (MSE):
Compute the overall Fstat test statistic.
Is the Fstat significant at the 0.05 level?
A linear regression was run on auto sales relative to consumer
income. The Regression Sum of Squares (SSR) was 360 and...
 Part a)
Compute the regression line for these data, and provide your
estimates of the slope and intercept parameters. Please round
intermediate results to 6 decimal places.
Slope:
Intercept:
Note: For sub-parts below, use the slope and intercept
values in Part a, corrected to 3 decimal places to calculate
answers by hand using a scientific calculator.
Part b)
Based on the regression model, what level of horsepower would you
expect the engine to produce if running at 24002400 rpm?
Answer:...
Part a)
Compute the regression line for these data, and provide your
estimates of the slope and intercept parameters. Please round
intermediate results to 6 decimal places.
Slope:
Intercept:
Note: For sub-parts below, use the slope and intercept
values in Part a, corrected to 3 decimal places to calculate
answers by hand using a scientific calculator.
Part b)
Based on the regression model, what level of horsepower would you
expect the engine to produce if running at 24002400 rpm?
Answer:...
 (I did this homework in completion but professor was
not happy with answers whatsoever, need additional answers and
especially improvement to 1.b
help!! photos not attaching?
mean by severai steps. inis is a View Feedback homework and will need you to work, in one two View Feedback or various steps. Unfortunately, I cannot read your screen shot of what you did on excel. As I have said in numerous messages announcements etc, I cannot аcсept pictures. You need to write...
(I did this homework in completion but professor was
not happy with answers whatsoever, need additional answers and
especially improvement to 1.b
help!! photos not attaching?
mean by severai steps. inis is a View Feedback homework and will need you to work, in one two View Feedback or various steps. Unfortunately, I cannot read your screen shot of what you did on excel. As I have said in numerous messages announcements etc, I cannot аcсept pictures. You need to write...
 Gain (V/V) R Setting Totals Averages Sample 1 Sample 2 Sample 3 4 ап 7.8 8.1 7.9 3 5.2 6.0 4.3 = 359.3 i=1 j=1 2 4.4 6.9 3.8 1 2.0 1.7 0.8 This is actual data from one of Joe Tritschler's audio engineering experiments. Use Analysis of Variance (ANOVA) to test the null hypothesis that the treatment means are equal at the a = 0.05 level of significance. Fill in the ANOVA table. Source of Variation Sum of Squares...
 Gain (V/V) R Setting Totals Averages Sample 1 Sample 2 Sample 3 4 ап 7.8 8.1 7.9 3 5.2 6.0 4.3 = 359.3 i=1 j=1 2 4.4 6.9 3.8 1 2.0 1.7 0.8 This is actual data from one of Joe Tritschler's audio engineering experiments. Use Analysis of Variance (ANOVA) to test the null hypothesis that the treatment means are equal at the a = 0.05 level of significance. Fill in the ANOVA table. Source of Variation Sum of Squares...
 All of the following questions are in relation to the following journal article which is available on Moodle: Parr CL, Magnus MC, Karlstad O, Holvik K, Lund-Blix NA, Jaugen M, et al. Vitamin A and D intake in pregnancy, infant supplementation and asthma development: the Norwegian Mother and Child Cohort. Am J Clin Nutr 2018:107:789-798 QUESTIONS: 1. State one hypothesis the author's proposed in the manuscript. 2. There is previous research that shows that adequate Vitamin A intake is required...
Most questions answered within 3 hours.
-
If 20 g of Na2SO4 is reacted with 20 g of
Al(NO3)3 according to the following...
asked 4 minutes ago -
One difference between periodic and perpetual inventory systems
is:
Multiple Choice Cost of goods sold is...
asked 10 minutes ago -
Using the OSHA web site find the OSHA regulation for personal eye
protection. Write a summary...
asked 9 minutes ago -
In 600 words, answer the following
1) Why has the transfer of defense technologies to domestic...
asked 9 minutes ago -
Balance the following oxidation-reduction equations using redox
methods:
Cu + H+ --------> Cu+ +
H2
asked 30 minutes ago -
For a voltaic cell based on the reaction below, which statement
is correct?
Zn(s)+2H+(aq)→Zn2+(aq)+H2(g)
Zn2+(aq) is...
asked 13 minutes ago -
For the balanced reaction: CaCl2 (aq) + Na2CO3 (aq) -> CaCO3
(s) + 2 NaCl (aq),...
asked 23 minutes ago -
1. If ln(x)=ln(x)= -0.2 , what does xx equal? Round
your answer to three significant figures. The...
asked 20 minutes ago -
what is the current research being done on the hexokinase
enzyme?
asked 26 minutes ago -
An incline weighing 1,106 kg with its passengers travels uphill
800 meters on a 30 degree...
asked 26 minutes ago -
Let’s assume you want to retire with $1,000,000 in your
investment portfolio. Given that your investment...
asked 26 minutes ago -
profit motivation is one of the biggest differences between
public and private organizations. what about resource...
asked 25 minutes ago