
R(s) E(s) Y(s) 10 +0.1 0.01s Figure 8P-24
Homework Answers
Add Answer to:
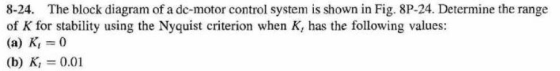
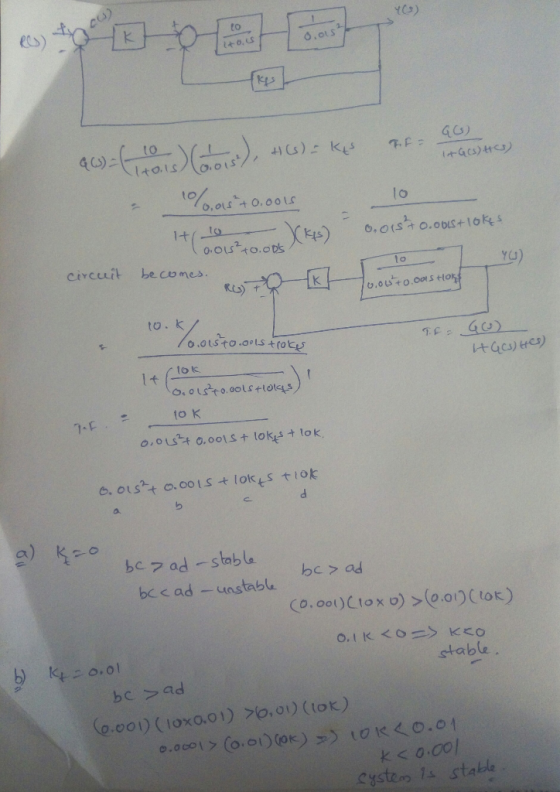
8-24. The block diagram of a de-motor control system is shown in Fig. 8P-24. Determine the range ...
In the figure below given is the block diagram representation of the DC motor position control sy...
 In the figure below given is the block diagram representation of the DC motor position control system with a combined unity feedback and rate (tachometer) feedback. 2. C(s) R(s) Kp 0.25s+1 s+1 Kv Determine the characteristic polynomial of the closed loop transfer function Using Routh criterion, determine the range for Kp and Kv which make the closed loop system stable. Draw the admissible region for stability on Kv versus Kp plane.
In the figure below given is the block diagram...
In the figure below given is the block diagram representation of the DC motor position control system with a combined unity feedback and rate (tachometer) feedback. 2. C(s) R(s) Kp 0.25s+1 s+1 Kv Determine the characteristic polynomial of the closed loop transfer function Using Routh criterion, determine the range for Kp and Kv which make the closed loop system stable. Draw the admissible region for stability on Kv versus Kp plane.
In the figure below given is the block diagram...
b) Following figure shows a block diagram of a control system. Obtain the characteristics equation of...
 b) Following figure shows a block diagram of a control system. Obtain the characteristics equation of the system. [5 marks] Determine the limiting value of K for stability using Routh's criterion. [10 marks] R(S) 20 C(s) 4K S +1 2s+1 0.2 Fig. Q3
Q2. Fig Q2 shows the block diagram of an unstable system with transfer function G(s) -...
 Q2. Fig Q2 shows the block diagram of an unstable system with transfer function G(s) - under the control of a lead compensator (a) Using the Routh's stability criterion, determine the conditions on k and a so that the closed-loop system is stable, and sketch the region on the (k, a)- plane where the conditions are satisfied. Hence, determine the minimum value of k for the lead compensator to be a feasible stabilizing controller. (10 marks) (b) Suppose α-2. Given...
3-21. The block diagram of a control system is shown in Fig. 3P-21. (a) Draw an...
 3-21. The block diagram of a control system is shown in Fig. 3P-21. (a) Draw an equivalent SFG for the system. (b) Find the following transfer functions by applying the gain formula of the SFG directly to the block diagram. Y(s) Y(s) E(s) E(s) R(s)[N=0 N(s)R=0 R(s) N= N(s) R-0 (c) Compare the answers by applying the gain formula to the equivalent SFG. N() G (s) E(s) YS G () G3(s) H () Figure 3P-21
b) The Nyquist plot of a unity feedback control system is as shown in Figure Q5(b)....
 b) The Nyquist plot of a unity feedback control system is as shown in Figure Q5(b). Nyqulst Diagram x 10 1.5 1- System: N Real: -9.08e-005 0.5- Imag: -5.62e-006 Frequency (rad/sec): -104 -0.5 -15 -1.5 0.5 0.5 1.5 1 2.5 3.5 Real Axis x 10 Figure Q5(b) K If the transfer function of the system is given as G(s) (s+10)(s+50)(s+150) determine the following: The closed loop stability of the system using Nyquist Stability Criterion. i) ii) Gain margin and phase...
1- Consider the block diagram of a control system shown in Fig. 1 Rts) E ts) C(s) Gt-11027 20s Fi...
 1- Consider the block diagram of a control system shown in Fig. 1 Rts) E ts) C(s) Gt-11027 20s Fig. 1 a) Find the open-loop transfer function of the system. b) Determine the system type and open-loop gain in terms of K and K, c) Find the steady-state errors of the system in terms of K and K,when the following reference inputs are applied: a. Unit ramp reference input: ) b. Parabolic reference input: r()
1- Consider the block diagram...
1- Consider the block diagram of a control system shown in Fig. 1 Rts) E ts) C(s) Gt-11027 20s Fig. 1 a) Find the open-loop transfer function of the system. b) Determine the system type and open-loop gain in terms of K and K, c) Find the steady-state errors of the system in terms of K and K,when the following reference inputs are applied: a. Unit ramp reference input: ) b. Parabolic reference input: r()
1- Consider the block diagram...
1. (30 points) The block diagram of a machine-tool control system is shown in Figure 1. (a) (10 p...
 1. (30 points) The block diagram of a machine-tool control system is shown in Figure 1. (a) (10 points) Determine the transfer function H(s) = Y(s)/R(s) (b) (10 points) Determine the sensitivity S (c) (10 points) For 1
5. Answer the following questions regarding the block diagram of the feedback control system. Gm (1)...
 5. Answer the following questions regarding the block diagram of the feedback control system. Gm (1) G,(s)= K., Gm (s) = Gy(s)=1, G,(s) = 100+1. Show that the feedback control system is always stable when K. > 0. (2) G(s)=K. Gr(s)= 1817, Gp(s)=1, Gr(s)=e** Use Bode Criterion to determine K range that ensure feedback control system stable (3) Also, Use 1* Padé approximant at time delay in (2) to determine the range of 1-5$ - K at which the feedback...
For the block diagram of a feedback control system that is shown in Figure Q1 below,...
 For the block diagram of a feedback control system that is shown in Figure Q1 below, find the transfer function Ts) Y(s) /R(s) for the system. 2 R(s) Y(s) :? 2 2 Figure Q1
8. The input r(t) and output y(t) of a transfer function block are sin(wt) and A...
 8. The input r(t) and output y(t) of a transfer function block are sin(wt) and A sin(at +) respectively and ti are shown in the following figure. Determine the most suitable values for A and . a. A = 1.67 and $ = 45° b. A = 1.67 and $ = -45° C. A = 0.6 and $ = 45° d. A = 0.6 and 6 = -45° 9. Routh criterion is applied to check the stability of polynomials +s...
 In the figure below given is the block diagram representation of the DC motor position control system with a combined unity feedback and rate (tachometer) feedback. 2. C(s) R(s) Kp 0.25s+1 s+1 Kv Determine the characteristic polynomial of the closed loop transfer function Using Routh criterion, determine the range for Kp and Kv which make the closed loop system stable. Draw the admissible region for stability on Kv versus Kp plane.
In the figure below given is the block diagram...
In the figure below given is the block diagram representation of the DC motor position control system with a combined unity feedback and rate (tachometer) feedback. 2. C(s) R(s) Kp 0.25s+1 s+1 Kv Determine the characteristic polynomial of the closed loop transfer function Using Routh criterion, determine the range for Kp and Kv which make the closed loop system stable. Draw the admissible region for stability on Kv versus Kp plane.
In the figure below given is the block diagram...
 b) Following figure shows a block diagram of a control system. Obtain the characteristics equation of the system. [5 marks] Determine the limiting value of K for stability using Routh's criterion. [10 marks] R(S) 20 C(s) 4K S +1 2s+1 0.2 Fig. Q3
 Q2. Fig Q2 shows the block diagram of an unstable system with transfer function G(s) - under the control of a lead compensator (a) Using the Routh's stability criterion, determine the conditions on k and a so that the closed-loop system is stable, and sketch the region on the (k, a)- plane where the conditions are satisfied. Hence, determine the minimum value of k for the lead compensator to be a feasible stabilizing controller. (10 marks) (b) Suppose α-2. Given...
 3-21. The block diagram of a control system is shown in Fig. 3P-21. (a) Draw an equivalent SFG for the system. (b) Find the following transfer functions by applying the gain formula of the SFG directly to the block diagram. Y(s) Y(s) E(s) E(s) R(s)[N=0 N(s)R=0 R(s) N= N(s) R-0 (c) Compare the answers by applying the gain formula to the equivalent SFG. N() G (s) E(s) YS G () G3(s) H () Figure 3P-21
 b) The Nyquist plot of a unity feedback control system is as shown in Figure Q5(b). Nyqulst Diagram x 10 1.5 1- System: N Real: -9.08e-005 0.5- Imag: -5.62e-006 Frequency (rad/sec): -104 -0.5 -15 -1.5 0.5 0.5 1.5 1 2.5 3.5 Real Axis x 10 Figure Q5(b) K If the transfer function of the system is given as G(s) (s+10)(s+50)(s+150) determine the following: The closed loop stability of the system using Nyquist Stability Criterion. i) ii) Gain margin and phase...
 1- Consider the block diagram of a control system shown in Fig. 1 Rts) E ts) C(s) Gt-11027 20s Fig. 1 a) Find the open-loop transfer function of the system. b) Determine the system type and open-loop gain in terms of K and K, c) Find the steady-state errors of the system in terms of K and K,when the following reference inputs are applied: a. Unit ramp reference input: ) b. Parabolic reference input: r()
1- Consider the block diagram...
1- Consider the block diagram of a control system shown in Fig. 1 Rts) E ts) C(s) Gt-11027 20s Fig. 1 a) Find the open-loop transfer function of the system. b) Determine the system type and open-loop gain in terms of K and K, c) Find the steady-state errors of the system in terms of K and K,when the following reference inputs are applied: a. Unit ramp reference input: ) b. Parabolic reference input: r()
1- Consider the block diagram...
 1. (30 points) The block diagram of a machine-tool control system is shown in Figure 1. (a) (10 points) Determine the transfer function H(s) = Y(s)/R(s) (b) (10 points) Determine the sensitivity S (c) (10 points) For 1
 5. Answer the following questions regarding the block diagram of the feedback control system. Gm (1) G,(s)= K., Gm (s) = Gy(s)=1, G,(s) = 100+1. Show that the feedback control system is always stable when K. > 0. (2) G(s)=K. Gr(s)= 1817, Gp(s)=1, Gr(s)=e** Use Bode Criterion to determine K range that ensure feedback control system stable (3) Also, Use 1* Padé approximant at time delay in (2) to determine the range of 1-5$ - K at which the feedback...
 For the block diagram of a feedback control system that is shown in Figure Q1 below, find the transfer function Ts) Y(s) /R(s) for the system. 2 R(s) Y(s) :? 2 2 Figure Q1
 8. The input r(t) and output y(t) of a transfer function block are sin(wt) and A sin(at +) respectively and ti are shown in the following figure. Determine the most suitable values for A and . a. A = 1.67 and $ = 45° b. A = 1.67 and $ = -45° C. A = 0.6 and $ = 45° d. A = 0.6 and 6 = -45° 9. Routh criterion is applied to check the stability of polynomials +s...
Most questions answered within 3 hours.
-
1. Add hydrochloric acid (HCl) to magnesium metal in a test
tube.
Observations: &
asked 59 seconds from now -
Calculate the volume in milliliters of a 1.4 mol/L barium
acetate solution that contains 200.g of...
asked 48 seconds from now -
A consumer can choose between two gambles. The “sure thing”
guaranteesadditional income (I) of $250,000. The...
asked 15 seconds ago -
There are 9 women and 6 men in a department. A committee of four
is to...
asked 2 minutes ago -
Arthur Meiners is the production manager of Wheel-Rite, a small
producer of metal parts. Wheel-Rite supplies...
asked 16 minutes ago -
Company Risk Premium A company has a beta of
4.57. If the market return is expected...
asked 15 minutes ago -
3. Which statement about nuclear fission is correct? (1
point)
A. Nuclear fission provides energy for...
asked 21 minutes ago -
If a $2,000 increase in income leads to a $1,5000 increase in
consumption expenditures, then the...
asked 21 minutes ago -
May you please put this in layman's terms?
ABSTRACT
Coagulase-negative staphylococci (CoNS) and Staphylococcus
aureus are...
asked 25 minutes ago -
If authentic leadership is really a lifelong process,
can teenagers be authentic leaders? Why or why...
asked 41 minutes ago -
Six years of quarterly data of a seasonally adjusted series are
used to estimate a linear...
asked 1 hour ago -
Which of the following is not an ecological model used
to foster behavior change?
PRECEDE-PROCEED Model...
asked 1 hour ago