
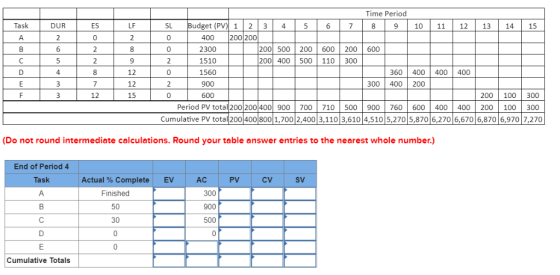
Time Period Task LF DUR ES SL Budget (PV) 1 23 4 5 67 89 10 11 1213 14 15 400 200 200 2300 1510 1560 900 600 00 500 200 600 200 600 200 400 500 110 300 4 12 12 15 0 360 400 400 400 300 400 200 12 200 100 300 Period PV total 200 200400 900 700 710 500 900 760 600 400400 200 100 300 Cumulative PV total 200 400 800 1,700 2,400 3,110 3,610 4,510 5,270 5,870 6,270 6,670 6,870 6,970 7,270 (Do not round intermediate calculations. Round your table answer entries to the nearest whole number.) End of Period 4 Task CV SV Actual %Complete Finished 50 30 EV PV AC 300 900 500 Cumulative Totals
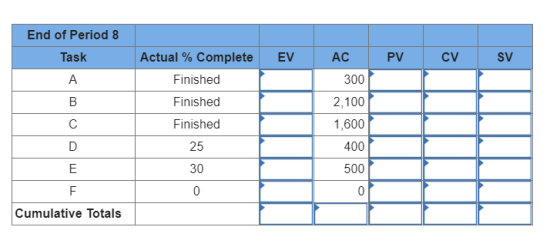
End of Period 8 Task SV Actual % Complete Finished Finished Finished 25 30 EV AC CV PV 300 2,100 1,600 400 500 Cumulative Totals
Homework Answers
| 1 | B | C | D | E | F | G | H |
| 2 | End of Period 4 | ||||||
| 3 | Task | Actual % Complete | EV | AC | PV | CV | SV |
| 4 | A | Finished | 400 | 300 | 400 | 100 | 0 |
| 5 | B | 50 | 1150 | 900 | 700 | 250 | 450 |
| 6 | C | 30 | 453 | 500 | 600 | -47 | -147 |
| 7 | D | 0 | 0 | 0 | 0 | 0 | 0 |
| 8 | E | 0 | 0 | 0 | 0 | 0 | 0 |
| 9 | Cumulative Totals | 2003 | 1700 | 1700 | 303 | 303 | |
| 10 | |||||||
| 11 | End of Period 8 | ||||||
| 12 | Task | Actual % Complete | EV | AC | PV | CV | SV |
| 13 | A | Finished | 400 | 300 | 400 | 100 | 0 |
| 14 | B | Finished | 2300 | 2100 | 2300 | 200 | 0 |
| 15 | C | Finished | 1510 | 1600 | 1510 | -90 | 0 |
| 16 | D | 25 | 390 | 400 | 0 | -10 | 390 |
| 17 | E | 30 | 270 | 500 | 300 | -230 | -30 |
| 18 | F | 0 | 0 | 0 | 0 | 0 | 0 |
| 19 | Cumulative Totals | 4870 | 4900 | 4510 | -30 | 360 |
Formula
| 1 | B | C | D | E | F | G | H |
| 2 | End of Period 4 | ||||||
| 3 | Task | Actual % Complete | EV | AC | PV | CV | SV |
| 4 | A | Finished | 400 | 300 | 400 | =D4-E4 | =D4-F4 |
| 5 | B | 50 | =(200+500+200+600+200+600)*C5/100 | 900 | 700 | =D5-E5 | =D5-F5 |
| 6 | C | 30 | =(200+400+500+110+300)*C6/100 | 500 | 600 | =D6-E6 | =D6-F6 |
| 7 | D | 0 | =F7*C7/100 | 0 | 0 | =D7-E7 | =D7-F7 |
| 8 | E | 0 | =F8*C8/100 | 0 | 0 | =D8-E8 | =D8-F8 |
| 9 | Cumulative Totals | =SUM(D4:D8) | =SUM(E4:E8) | =SUM(F4:F8) | =D9-E9 | =D9-F9 | |
| 10 | |||||||
| 11 | End of Period 8 | ||||||
| 12 | Task | Actual % Complete | EV | AC | PV | CV | SV |
| 13 | A | Finished | 400 | 300 | 400 | =D13-E13 | =D13-F13 |
| 14 | B | Finished | 2300 | 2100 | =(200+500+200+600+200+600) | =D14-E14 | =D14-F14 |
| 15 | C | Finished | 1510 | 1600 | =(200+400+500+110+300) | =D15-E15 | =D15-F15 |
| 16 | D | 25 | =(360+400+400+400)*25/100 | 400 | 0 | =D16-E16 | =D16-F16 |
| 17 | E | 30 | =(300+400+200)*30/100 | 500 | 300 | =D17-E17 | =D17-F17 |
| 18 | F | 0 | 0 | 0 | 0 | =D18-E18 | =D18-F18 |
| 19 | Cumulative Totals | =SUM(D13:D18) | =SUM(E13:E18) | =SUM(F13:F18) | =D19-E19 | =D19-F19 |
Add Answer to:
Given the project network and baseline information below, complete the form to develop a status r...
3) You are in charge of the Aurora Project. Given the following project network, baseline, and...
 3) You are in charge of the Aurora Project. Given the following project network, baseline, and status information, (40 Points) B DI OA E • Develop status reports for periods 7 and complete the performance indices table. . Calculate the EAC, and VAC. Based on your data, what is the current status of the project? At completion? Rule 1 0% complete 2-50/50 3 - 0/100 ID LF SL Schedule information Total 0 1 2 PV 3 4 30 5 6...
Your organization is preparing a new marketing campaign. The test marketing project plan and the information...
 Your organization is preparing a new marketing campaign. The test marketing project plan and the information reported at the end of week 6 are presented in the table below: Duration (weeks) Activity Predecessors Budget, $ Actual Cost, $ % Complete 400 200 a: Build items b: Supply stores c: Create ad program d: Schedule ads e: Check sale results 180 300 Solo bc 200 Ignore the last column "% complete" and use the rule 50-50 percent completion rule for the...
Project ABC Scope = 10 chairs @ $10.00 = $100.00 PV = Timeframe = 10 days...
Project ABC Scope = 10 chairs @ $10.00 = $100.00 PV = Timeframe = 10 days AC = At the End of the 5th day 4 chairs were EV = Completed at a cost of $11.00 each CV = CPI= SV = SPI= CR = To install a 10,000 feet fence at a cost of $10.00/per foot. It is estimated that 500 feet of fence can be installed per week for a total of 20 weeks. After 12 weeks and...
Complete the following exercises and submit them in a word document (10 points). Project ABC Scope...
 Complete the following exercises and submit them in a word document (10 points). Project ABC Scope = 10 chairs @ $10.00 = $100.00 PV = Timeframe = 10 days At the End of the 5th day 4 chairs were EV = Completed at a cost of $11.00 each CPLE SV = SPIE To install a 10,000 feet fence at a cost of $10.00/per foot. It is estimated that 500 feet of fence can be installed per week for a total...
Below is the network diagram for a construction project. Given ONLY THREE (3) workers are available...
 Below is the network diagram for a construction project. Given ONLY THREE (3) workers are available at all times, develop a resource schedule using the parallel heuristics for resource-constrained projects. 0 A 1 1 2 1 1 1 2 4 E 7 0 0 4 3 7 IN نا 7 G 2 c 4 3 0 2 24 1 ON 0 7 00 000 7 1 4 1 F 1 0 B 2 02 o 0 2 2 N ON...
Below is the time-phased baseline budget for a project and a table showing the progress as...
Below is the time-phased baseline budget for a project and a table showing the progress as of End of Period 7. Baseline PV Task Total PV Time Period 0 1 2 3 4 5 6 7 8 9 10 11 A 30 15 15 B 40 20 20 C 80 10 10 10 10 20 20 D 30 5 5 5 5 10 E 20 5 5 5 5 F 40 10 20 5 5 G 10 5 5 PV...
PLEASE SHOW ALL CALCULATIONS. PLEASE DRAW A NETWORK DIAGRAM AS WELL. The following project is at...
PLEASE SHOW ALL CALCULATIONS. PLEASE DRAW A NETWORK DIAGRAM AS WELL. The following project is at the end of its 6th week. Find the cost and schedule variances. Also find the CPI and SPI. Then find the critical ratio of the project using earned value calculations. Finally, calculate the EAC for the project by at least two different methods. Activity Predecessor Duration (wks) Budget ($) Actual Cost ($) %Complete a - 2 600 400 100 b - 3 150 180...
At week 10 of a project below to improve distance learning platform, assume that the planned...
At week 10 of a project below to improve distance learning platform, assume that the planned values (PV) are based on time proportionality but the “% Complete” values for earned values (EV) are from the workers actually doing the tasks. ACTIVITY PRE- DECESSORS DURATION (WEEKS) BUDGET ($) ACTUAL COST ($) % COMPLETE A - 5 500 640 100 B A 3 300 400 100 C B 4 320 310 80 D B 6 600 250 60 E C,D 3 300...
Question 9 Below is the time phased baseline budget for a project and a table showing...
 Question 9 Below is the time phased baseline budget for a project and a table showing the progress as of End of Period 7. 2 Baseline PV Total Task Time Period PV 0 1 3 5 6 7 8 10 11 A 30 15 15 40 20 20 с 80 10 10 10 10 20 20 D 30 5 5 5 5 10 E 20 5 5 5 5 F 40 10 20 5 5 10 5 5 PV by...
Studern Date: 08/12/2018 #1, #2and #3 are based onthe below given information: Task z Corporation's Balance...
 Studern Date: 08/12/2018 #1, #2and #3 are based onthe below given information: Task z Corporation's Balance Sheet is made from: Date 31/12/17 31/12/16 1) Equipment 2) Bank Loans (Long Term) 74 000 21 000 1 200 6 300 14 200 2 000 3 400 4 200 26 100 7600 13 000 23 400 300 45 000 4 300 23 700 8 000 12 000 11 900 29 500 13 500 3 100 23 000 200 23 000 6 500 6...
 3) You are in charge of the Aurora Project. Given the following project network, baseline, and status information, (40 Points) B DI OA E • Develop status reports for periods 7 and complete the performance indices table. . Calculate the EAC, and VAC. Based on your data, what is the current status of the project? At completion? Rule 1 0% complete 2-50/50 3 - 0/100 ID LF SL Schedule information Total 0 1 2 PV 3 4 30 5 6...
 Your organization is preparing a new marketing campaign. The test marketing project plan and the information reported at the end of week 6 are presented in the table below: Duration (weeks) Activity Predecessors Budget, $ Actual Cost, $ % Complete 400 200 a: Build items b: Supply stores c: Create ad program d: Schedule ads e: Check sale results 180 300 Solo bc 200 Ignore the last column "% complete" and use the rule 50-50 percent completion rule for the...
 Complete the following exercises and submit them in a word document (10 points). Project ABC Scope = 10 chairs @ $10.00 = $100.00 PV = Timeframe = 10 days At the End of the 5th day 4 chairs were EV = Completed at a cost of $11.00 each CPLE SV = SPIE To install a 10,000 feet fence at a cost of $10.00/per foot. It is estimated that 500 feet of fence can be installed per week for a total...
 Below is the network diagram for a construction project. Given ONLY THREE (3) workers are available at all times, develop a resource schedule using the parallel heuristics for resource-constrained projects. 0 A 1 1 2 1 1 1 2 4 E 7 0 0 4 3 7 IN نا 7 G 2 c 4 3 0 2 24 1 ON 0 7 00 000 7 1 4 1 F 1 0 B 2 02 o 0 2 2 N ON...
 Question 9 Below is the time phased baseline budget for a project and a table showing the progress as of End of Period 7. 2 Baseline PV Total Task Time Period PV 0 1 3 5 6 7 8 10 11 A 30 15 15 40 20 20 с 80 10 10 10 10 20 20 D 30 5 5 5 5 10 E 20 5 5 5 5 F 40 10 20 5 5 10 5 5 PV by...
 Studern Date: 08/12/2018 #1, #2and #3 are based onthe below given information: Task z Corporation's Balance Sheet is made from: Date 31/12/17 31/12/16 1) Equipment 2) Bank Loans (Long Term) 74 000 21 000 1 200 6 300 14 200 2 000 3 400 4 200 26 100 7600 13 000 23 400 300 45 000 4 300 23 700 8 000 12 000 11 900 29 500 13 500 3 100 23 000 200 23 000 6 500 6...
Most questions answered within 3 hours.
-
An MNE is this kind of industry when competition in one country
is essentially independent of...
asked 48 minutes ago -
. For this set of questions, determine what
proportion of a normal distribution is located betweeneach...
asked 1 hour ago -
A college student is employed as a door-to-door newspaper
salesman. Historical data suggests that the student...
asked 2 hours ago -
MATLAB HW 11 problem using Switch Case and Input commands
Write a script file that calculates...
asked 2 hours ago -
Considering gravitational time dilation, calculate the time that
passes in Earth’s surface while 1 hour passes...
asked 2 hours ago -
Minitab Problem: Take the Lake Hume June rainfall data and find
use the processes outlined in...
asked 3 hours ago -
X Company is trying to decide whether to continue using old
equipment to make Product A...
asked 3 hours ago -
IN PYTHON ONLY !! Program 2: Re-work
program #5 (WeeklyHours) from the previous assignment such that...
asked 4 hours ago -
The average length of time between arrivals at a turnpike
toll-booth is 26 seconds. What is...
asked 5 hours ago -
(a) A piston at 6.1 atm contains a gas that occupies a volume of
3.5 L....
asked 7 hours ago -
Please answer true or false. Words
cannot be changed or added in to make it true...
asked 7 hours ago -
An empty test tube weighs 15.923 grams. Then,
MgCl2•6H2O is added into the test tube. After...
asked 7 hours ago