please use manual calculations do not use excel, please
Homework Answers
4)
Add Answer to:
For each question, assume you're using an alpha of 05, and a two-tailed test, to make your decisi...
Assume that Data Set C depicts scores for 30 individuals who participated in a two-way independent groups design. Analyze the data using a two-way ANOVA and complete an ANOVA table reporting the relev...
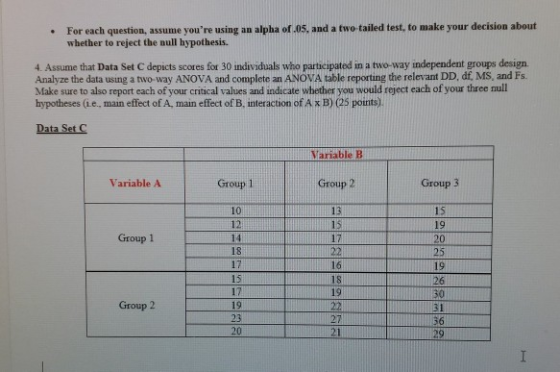
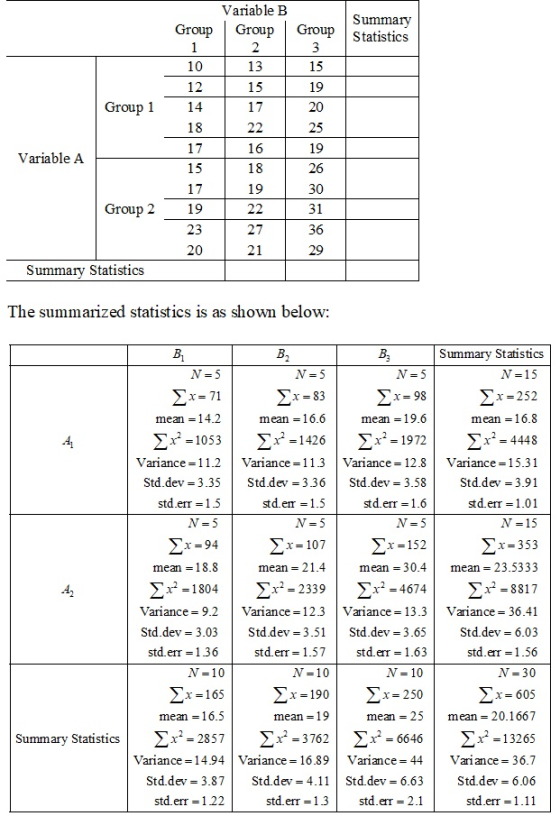
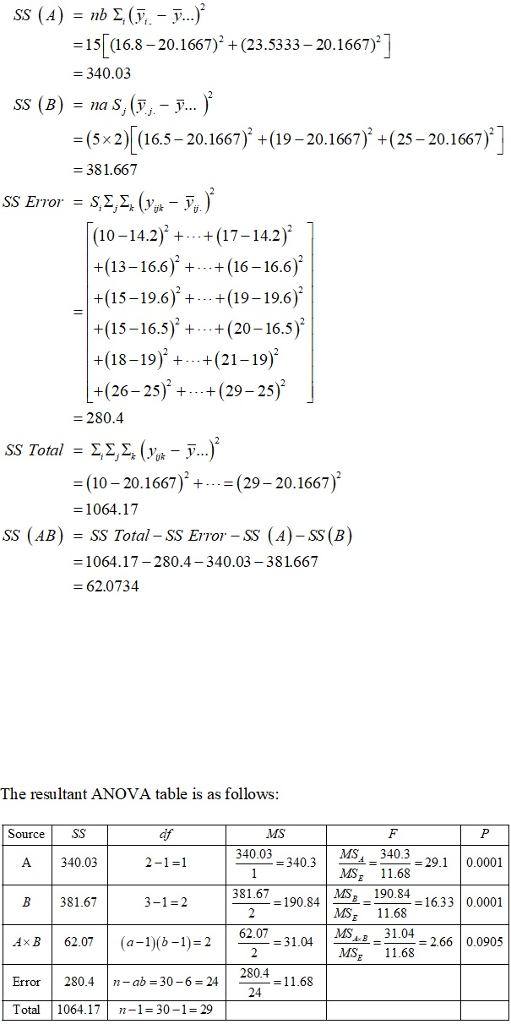
Assume that Data Set C depicts scores for 30 individuals who participated in a two-way independent groups design. Analyze the data using a two-way ANOVA and complete an ANOVA table reporting the relevant DD, df, MS, and Fs. Make sure to also report each of your critical values and indicate whether you would reject each of your three null hypotheses (i.e., main effect of A, main effect of B, interaction of A x B) Data Set C Variable B Variable...
Assume that Data Set C depicts scores for 30 individuals who participated in a two-way independent...
 Assume that Data Set C depicts scores for 30
individuals who participated in a two-way independent groups
design. Analyze the data using a two-way ANOVA and complete an
ANOVA table reporting the relevant DD, df, MS, and Fs. Make sure to
also report each of your critical values and indicate whether you
would reject each of your three null hypotheses (i.e., main effect
of A, main effect of B, interaction of A x B). Use a two-tailed
alpha of .05...
Assume that Data Set C depicts scores for 30
individuals who participated in a two-way independent groups
design. Analyze the data using a two-way ANOVA and complete an
ANOVA table reporting the relevant DD, df, MS, and Fs. Make sure to
also report each of your critical values and indicate whether you
would reject each of your three null hypotheses (i.e., main effect
of A, main effect of B, interaction of A x B). Use a two-tailed
alpha of .05...
Please: You may NOT use Excel, SPSS, or any other statistical software to get your answers....
Please: You may NOT use Excel, SPSS, or any other statistical software to get your answers. You must show all of your by-hand computations for full credit. assume you’re using an alpha of .05, and a two-tailed test, to make your decision about whether to reject the null hypothesis. Assume that Data Set C depicts scores for 30 individuals who participated in a two-way independent groups design. Analyze the data using a two-way ANOVA and complete an ANOVA table reporting...
i need help with this question, please show work by hand no excel, spss thank you ! Assume you're using an alpha of 05, and a two-tailed test, to make your decision about whether to reject...
 i
need help with this question, please show work by hand no excel,
spss thank you !
Assume you're using an alpha of 05, and a two-tailed test, to make your decision about whether to reject the null hypothesis. Assume that 18 subjects received one of three treatments and produced the data reported in Data Set B. Conduct a one-way ANOVA to see if the means of the three treatments are different on a statistically significant level. Complete an ANOVA...
i
need help with this question, please show work by hand no excel,
spss thank you !
Assume you're using an alpha of 05, and a two-tailed test, to make your decision about whether to reject the null hypothesis. Assume that 18 subjects received one of three treatments and produced the data reported in Data Set B. Conduct a one-way ANOVA to see if the means of the three treatments are different on a statistically significant level. Complete an ANOVA...
A study compared three display panels used by air traffic controllers. Each display panel was tested...
A study compared three display panels used by air traffic controllers. Each display panel was tested for four different simulated emergency conditions. Twenty-four highly trained air traffic controllers were used in the study. Two controllers were randomly assigned to each display panel–emergency condition combination. The time (in seconds) required to stabilize the emergency condition was recorded. The resulting data and analysis results are given below. Display panel data Emergency condition Display panel 1 2 3 4 A 17 25 31...
Using the following data set, conduct an independent samples t-test. Use a= 0.05 and a two-tailed...
Using the following data set, conduct an independent samples t-test. Use a= 0.05 and a two-tailed test. Sample 1: 14, 14, 13, 13, 10, 12, 14, 15, 17 Sample 2: 15, 11, 15, 13, 14, 13, 14, 14, 15 1. hypotheses: null and alternative 2. t-critical value; shade of regions of rejection 3. t-obtain 4. conclusion 5. decide if significant 6. compute for confidence interval is significant
(a) Draw a curve and label each part to reflect a left, right, or two-tailed test...
(a) Draw a curve and label each part to reflect a left, right, or two-tailed test (b) Claim: Show in symbols H0, Ha (c) Critical value- find the z0 or t0 values (d) What are the standardized test statistic z or t, and the P values from the calculator? (e) Comparing the critical values, α value, against the calculator results, state whether you reject, or fail to reject the null hypothesis (f) Interpret the decision in the context of the...
Do a two-sample test for equality of means assuming unequal variances. Calculate the p-value using Excel....
Do a two-sample test for equality of means assuming unequal variances. Calculate the p-value using Excel. (a-1) Comparison of GPA for randomly chosen college juniors and seniors: x⎯⎯1x1 = 4.75, s1 = .20, n1 = 15, x⎯⎯2x2 = 5.18, s2 = .30, n2 = 15, α = .025, left-tailed test. (Negative values should be indicated by a minus sign. Round down your d.f. answer to the nearest whole number and other answers to 4 decimal places. Do not use "quick"...
 Assume that Data Set C depicts scores for 30
individuals who participated in a two-way independent groups
design. Analyze the data using a two-way ANOVA and complete an
ANOVA table reporting the relevant DD, df, MS, and Fs. Make sure to
also report each of your critical values and indicate whether you
would reject each of your three null hypotheses (i.e., main effect
of A, main effect of B, interaction of A x B). Use a two-tailed
alpha of .05...
Assume that Data Set C depicts scores for 30
individuals who participated in a two-way independent groups
design. Analyze the data using a two-way ANOVA and complete an
ANOVA table reporting the relevant DD, df, MS, and Fs. Make sure to
also report each of your critical values and indicate whether you
would reject each of your three null hypotheses (i.e., main effect
of A, main effect of B, interaction of A x B). Use a two-tailed
alpha of .05...
 i
need help with this question, please show work by hand no excel,
spss thank you !
Assume you're using an alpha of 05, and a two-tailed test, to make your decision about whether to reject the null hypothesis. Assume that 18 subjects received one of three treatments and produced the data reported in Data Set B. Conduct a one-way ANOVA to see if the means of the three treatments are different on a statistically significant level. Complete an ANOVA...
i
need help with this question, please show work by hand no excel,
spss thank you !
Assume you're using an alpha of 05, and a two-tailed test, to make your decision about whether to reject the null hypothesis. Assume that 18 subjects received one of three treatments and produced the data reported in Data Set B. Conduct a one-way ANOVA to see if the means of the three treatments are different on a statistically significant level. Complete an ANOVA...
Most questions answered within 3 hours.
-
Reynold company is considering an investment of $130,000 in
new equipment. The new equipment is expected...
asked 14 minutes ago -
If a company’s stock price (P0) goes up, and nothing else
changes, Ke (the required rate...
asked 1 minute ago -
As a manager in today society, how can I use Harry Truman's
leadership skills and attributes...
asked 2 minutes ago -
The decomposition of SO2Cl2 is first order
and has a rate constant of + 2.90 x...
asked 3 minutes ago -
Why is protecting equipment an important element of this
concept, and how are some of the...
asked 12 minutes ago -
An asset used in a four-year project falls in the five-year
MACRS class (MACRS Table) for...
asked 14 minutes ago -
Break-even time. Hampton Corporation’s research
and development department is presenting a proposal for new product
research....
asked 17 minutes ago -
At Lake Itasca in Minnesota, the Mississippi river is only 25.0
feet wide. If you are...
asked 18 minutes ago -
A 2.0 μF parallel-plate air-filled capacitor is connected
across a 10 V battery.
(a) Determine the...
asked 29 minutes ago -
Write in Python This program:
1. Correct the compute_cells_state function which receives as
parameter an array...
asked 19 minutes ago -
1. What is the difference in the output layer between a neural
network used for classification,...
asked 27 minutes ago -
ECO
2013 &
asked 33 minutes ago