
please answer this question subject about Business Statistics thanks
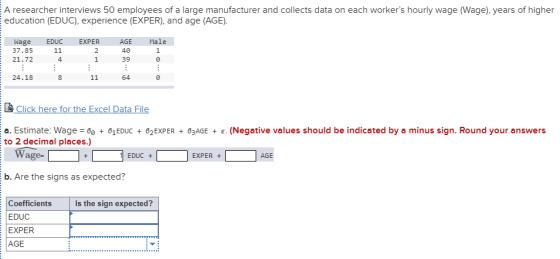
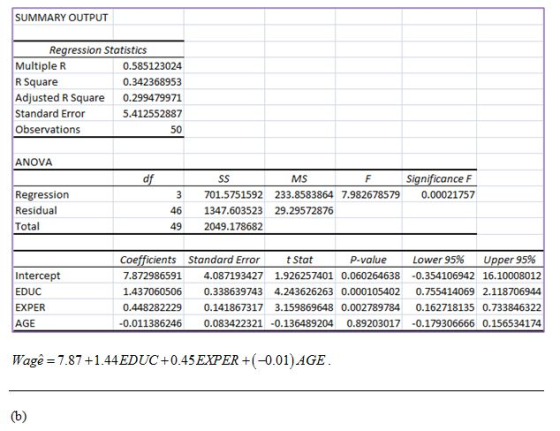
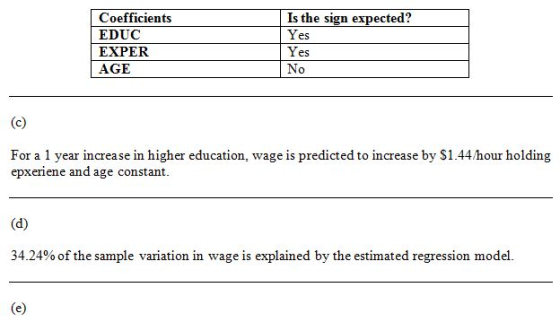
A researcher interviews 50 employees of a large manufacturer and collects data on each worker's hourly wage (Wage), years of higher education (EDUC), experience (EXPER), and age (AGE). Wage EDUC 37.85 21.72 EXPER 40 4 24.18 64 Xc a. Estimate: Wage-60-81EDUC + 62EXPER + 63AGE + E. (Negative values should be indicated by a minus sign. Round your answers to 2 decimal places.) Wage- AGE EDUC+ EXPER + b. Are the signs as expected? Is the sign expected? Coefficients EDUC EXPER AGE
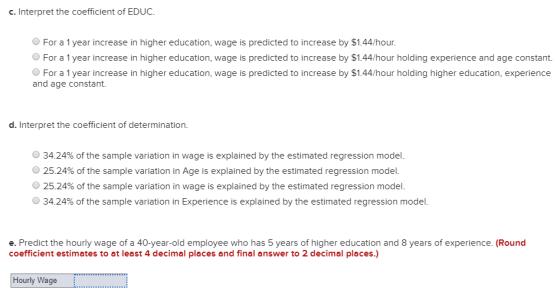
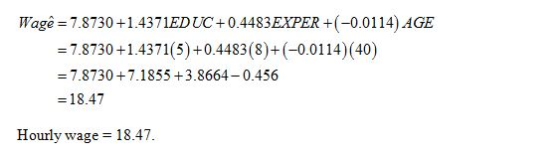
c. Interpret the coefficient of EDUC For a 1 year increase in higher education, wage is predicted to increase by $1.44/hour. For a 1 year increase in higher education, wage is predicted to increase by $1.44/hour holding experience and age constant. For a 1 year increase in higher education, wage is predicted to increase by $1.44/hour holding higher education, experience and age constant. d. Interpret the coefficient of determination. O 34.24% of the sample variation in wage is explained by the estimated regression model. O 25.24% of the sample variation in Age is explained by the estimated regression model. O 25.24% of the sample variation in wage is explained by the estimated regression model. O 34.24% of the sample variation in Experience is explained by the estimated regression model. e. Predict the hourly wage of a 40-year-old employee who has 5 years of higher education and 8 years of experience. (Round coefficient estimates to at least 4 decimal places and final answer to 2 decimal places.) Hourly Wage
Homework Answers
Add Answer to:
>|10|1|00001100-10110100 )13-175576 3 3 5 3 4 5 53 548532762 332244445 35931-12 10-4-0 5 2 2 1 7 ...
A researcher interviews 50 employees of a large manufacturer and collects data on each worker’s h...
 A researcher interviews 50 employees of a large manufacturer and
collects data on each worker’s hourly wage (Wage), years of higher
education (EDUC), experience (EXPER), and age (AGE).
Wage
EDUC
EXPER
AGE
Male
37.85
11
2
40
1
21.72
4
1
39
0
⋮
⋮
⋮
⋮
⋮
24.18
8
11
64
0
A researcher interviews 50 employees of a large manufacturer and collects data on each worker's hourly wage (Wage), years of higher education (EDUC), experience (EXPER), and age...
A researcher interviews 50 employees of a large manufacturer and
collects data on each worker’s hourly wage (Wage), years of higher
education (EDUC), experience (EXPER), and age (AGE).
Wage
EDUC
EXPER
AGE
Male
37.85
11
2
40
1
21.72
4
1
39
0
⋮
⋮
⋮
⋮
⋮
24.18
8
11
64
0
A researcher interviews 50 employees of a large manufacturer and collects data on each worker's hourly wage (Wage), years of higher education (EDUC), experience (EXPER), and age...
Suppose you are interested in studying the factors that influence wages. You plan on using a...
 Suppose you are interested in studying the factors that influence wages. You plan on using a multiple regression model with k = 3 explanatory variables. In particular, you plan on estimating: wage = Bo + Bieduc + Bzexper+Bz age where wage = hourly wage in dollars educ = years of education exper = years of work experience age = age, in years An alternative way of estimating Ba would be to regress wage on re , (wage; = Bo +...
Here is the information that is needed for this work: A researcher interviews 50 employees of a large manufacturer and colects data on each worker's hourly wage (Wage), years of higher education...
 Here is the information that is needed for this work:
A researcher interviews 50 employees of a large manufacturer and colects data on each worker's hourly wage (Wage), years of higher education (EDUC), experience (EXPER) and age AGE). The data can be found in the SPSS 6 Wage excel data file posted on Connect. Use SPSS to generate the output. Upload the one page Word file on to Connect by the due date. The face to face and hybrid students...
Here is the information that is needed for this work:
A researcher interviews 50 employees of a large manufacturer and colects data on each worker's hourly wage (Wage), years of higher education (EDUC), experience (EXPER) and age AGE). The data can be found in the SPSS 6 Wage excel data file posted on Connect. Use SPSS to generate the output. Upload the one page Word file on to Connect by the due date. The face to face and hybrid students...
QUESTION 6 For this question, you should load the R library wooldridge, first. This can be...
 QUESTION 6 For this question, you should load the R library wooldridge, first. This can be done by : library(wooldridge). Then import "cps91" to answer the question. Question : You would like to estimate the marginal effects of age, education, experience on hourly wage. The variables are labeled as age, educ, exper, and hwage respectively. What would be the regression equation you would estimate? Olwage = Bo +Bleduc +Bzexper+Bzage + u; Ohrwage = Be + Bleduc +Bzexper+B3age + u; Ohrwage...
QUESTION 1 Consider the following OLS regression line (or sample regression function): wage =-2.10+ 0.50 educ...
 QUESTION 1 Consider the following OLS regression line (or sample regression function): wage =-2.10+ 0.50 educ (1), where wage is hourly wage, measured in dollars, and educ years of formal education. According to (1), a person with no education has a predicted hourly wage of [wagehat] dollars. (NOTE: Write your answer in number format, with 2 decimal places of precision level; do not write your answer as a fraction. Add a leading minus sign symbol, a leading zero and trailing...
2 Using data from 50 workers, a researcher estimates Wage BoIEducation + 2Experience B3Age E, where...
 2 Using data from 50 workers, a researcher estimates Wage BoIEducation + 2Experience B3Age E, where Wage is the hourly wage rate and Education, Experience, and Age are the years of higher education, the years of experience, and the age of the worker respectively. The regression results are shown in the following table. 10 points Standard Coefficients t Stat P-Value 0.1310 0.0003 0.0022 Error 4.24 Intercept Education Experience Age 6.52 1.32 1.54 0.34 0.12 3.88 3.25 -0.20 0.39 0.01 0.05...
please be detailed in your response :) thank you! 0 pts) You are given the following estimated equation: In(wage) 0.1279+0.0904educ + 0.041 exper-0 (0.1059) (0.0075) (0.0052) (0.00012) R 0.3003 5...
 please be detailed in your response :) thank you!
0 pts) You are given the following estimated equation: In(wage) 0.1279+0.0904educ + 0.041 exper-0 (0.1059) (0.0075) (0.0052) (0.00012) R 0.3003 526 in which: log(wage) log of average hourly wage - educ is the number of years of schooling: - exper is the number of years of experience -exper'=experience"experience The plot of the residuals against the fitted values from the regression above, is provided below: .5 2.5 1.5 Fitted values a. With...
please be detailed in your response :) thank you!
0 pts) You are given the following estimated equation: In(wage) 0.1279+0.0904educ + 0.041 exper-0 (0.1059) (0.0075) (0.0052) (0.00012) R 0.3003 526 in which: log(wage) log of average hourly wage - educ is the number of years of schooling: - exper is the number of years of experience -exper'=experience"experience The plot of the residuals against the fitted values from the regression above, is provided below: .5 2.5 1.5 Fitted values a. With...
Using data from 50 workers, a researcher estimates Wage = β0 + β1Education + β2Experience +...
Using data from 50 workers, a researcher estimates Wage = β0 + β1Education + β2Experience + β3Age + ε, where Wage is the hourly wage rate and Education, Experience, and Age are the years of higher education, the years of experience, and the age of the worker, respectively. The regression results are shown in the following table. Coefficients Standard Error t Stat p-Value Intercept 7.17 4.26 1.68 0.0991 Education 1.81 0.35 5.17 0.0000 Experience 0.45 0.10 4.50 0.0000 Age −0.01...
Using data from 50 workers, a researcher estimates Wage = β0 + β1Education + β2Experience +...
Using data from 50 workers, a researcher estimates Wage = β0 + β1Education + β2Experience + β3Age + ε, where Wage is the hourly wage rate and Education, Experience, and Age are the years of higher education, the years of experience, and the age of the worker, respectively. The regression results are shown in the following table. Coefficients Standard Error t Stat p-Value Intercept 7.73 3.94 1.96 0.0558 Education 1.15 0.39 2.95 0.0050 Experience 0.45 0.11 4.09 0.0002 Age −0.03...
Using data from 50 workers, a researcher estimates Wage = β0 + β1Education + β2Experience +...
Using data from 50 workers, a researcher estimates Wage = β0 + β1Education + β2Experience + β3Age + ε, where Wage is the hourly wage rate and Education, Experience, and Age are the years of higher education, the years of experience, and the age of the worker, respectively. The regression results are shown in the following table. Coefficients Standard Error t Stat p-Value Intercept 8.23 4.40 1.87 0.0678 Education 1.23 0.38 3.24 0.0022 Experience 0.53 0.18 2.94 0.0051 Age −0.08...
 A researcher interviews 50 employees of a large manufacturer and
collects data on each worker’s hourly wage (Wage), years of higher
education (EDUC), experience (EXPER), and age (AGE).
Wage
EDUC
EXPER
AGE
Male
37.85
11
2
40
1
21.72
4
1
39
0
⋮
⋮
⋮
⋮
⋮
24.18
8
11
64
0
A researcher interviews 50 employees of a large manufacturer and collects data on each worker's hourly wage (Wage), years of higher education (EDUC), experience (EXPER), and age...
A researcher interviews 50 employees of a large manufacturer and
collects data on each worker’s hourly wage (Wage), years of higher
education (EDUC), experience (EXPER), and age (AGE).
Wage
EDUC
EXPER
AGE
Male
37.85
11
2
40
1
21.72
4
1
39
0
⋮
⋮
⋮
⋮
⋮
24.18
8
11
64
0
A researcher interviews 50 employees of a large manufacturer and collects data on each worker's hourly wage (Wage), years of higher education (EDUC), experience (EXPER), and age...
 Suppose you are interested in studying the factors that influence wages. You plan on using a multiple regression model with k = 3 explanatory variables. In particular, you plan on estimating: wage = Bo + Bieduc + Bzexper+Bz age where wage = hourly wage in dollars educ = years of education exper = years of work experience age = age, in years An alternative way of estimating Ba would be to regress wage on re , (wage; = Bo +...
 Here is the information that is needed for this work:
A researcher interviews 50 employees of a large manufacturer and colects data on each worker's hourly wage (Wage), years of higher education (EDUC), experience (EXPER) and age AGE). The data can be found in the SPSS 6 Wage excel data file posted on Connect. Use SPSS to generate the output. Upload the one page Word file on to Connect by the due date. The face to face and hybrid students...
Here is the information that is needed for this work:
A researcher interviews 50 employees of a large manufacturer and colects data on each worker's hourly wage (Wage), years of higher education (EDUC), experience (EXPER) and age AGE). The data can be found in the SPSS 6 Wage excel data file posted on Connect. Use SPSS to generate the output. Upload the one page Word file on to Connect by the due date. The face to face and hybrid students...
 QUESTION 6 For this question, you should load the R library wooldridge, first. This can be done by : library(wooldridge). Then import "cps91" to answer the question. Question : You would like to estimate the marginal effects of age, education, experience on hourly wage. The variables are labeled as age, educ, exper, and hwage respectively. What would be the regression equation you would estimate? Olwage = Bo +Bleduc +Bzexper+Bzage + u; Ohrwage = Be + Bleduc +Bzexper+B3age + u; Ohrwage...
 QUESTION 1 Consider the following OLS regression line (or sample regression function): wage =-2.10+ 0.50 educ (1), where wage is hourly wage, measured in dollars, and educ years of formal education. According to (1), a person with no education has a predicted hourly wage of [wagehat] dollars. (NOTE: Write your answer in number format, with 2 decimal places of precision level; do not write your answer as a fraction. Add a leading minus sign symbol, a leading zero and trailing...
 2 Using data from 50 workers, a researcher estimates Wage BoIEducation + 2Experience B3Age E, where Wage is the hourly wage rate and Education, Experience, and Age are the years of higher education, the years of experience, and the age of the worker respectively. The regression results are shown in the following table. 10 points Standard Coefficients t Stat P-Value 0.1310 0.0003 0.0022 Error 4.24 Intercept Education Experience Age 6.52 1.32 1.54 0.34 0.12 3.88 3.25 -0.20 0.39 0.01 0.05...
 please be detailed in your response :) thank you!
0 pts) You are given the following estimated equation: In(wage) 0.1279+0.0904educ + 0.041 exper-0 (0.1059) (0.0075) (0.0052) (0.00012) R 0.3003 526 in which: log(wage) log of average hourly wage - educ is the number of years of schooling: - exper is the number of years of experience -exper'=experience"experience The plot of the residuals against the fitted values from the regression above, is provided below: .5 2.5 1.5 Fitted values a. With...
please be detailed in your response :) thank you!
0 pts) You are given the following estimated equation: In(wage) 0.1279+0.0904educ + 0.041 exper-0 (0.1059) (0.0075) (0.0052) (0.00012) R 0.3003 526 in which: log(wage) log of average hourly wage - educ is the number of years of schooling: - exper is the number of years of experience -exper'=experience"experience The plot of the residuals against the fitted values from the regression above, is provided below: .5 2.5 1.5 Fitted values a. With...
Most questions answered within 3 hours.
-
What would you expect the observed boiling point to be at 10
torrs of a liquid...
asked 1 minute ago -
write a javascript jquery code to display calendar and let it be
sticked on the textbox...
asked 9 minutes ago -
A Call Spread is
A.
The simultaneous purchase of a call and
sale of a put...
asked 8 minutes ago -
In response to concerns about a future recession, the government
decides to give consumers a tax...
asked 10 minutes ago -
Experimental studies of cancer often use strains of animals that
have a naturally high incidence of...
asked 15 minutes ago -
Sociology Question Emile Durkheim
What role does mass media play in the lives of contemporary
citizens?...
asked 20 minutes ago -
Why would you silence gene expression for both wild-type and
mutants? I am on a question...
asked 29 minutes ago -
While all of the elements below are helpful, Booth et al. (2008)
emphasize that it is...
asked 33 minutes ago -
2. Use the three-step method to analyze the effects of the event
on the equilibrium price...
asked 34 minutes ago -
Draw a Venn diagram of three domains of life and explain.
asked 38 minutes ago -
In testing a new drug, researchers found that 5% of all patients
using it will have...
asked 1 hour ago -
List the six general types of information management systems,
and give one logistics application to each...
asked 57 minutes ago