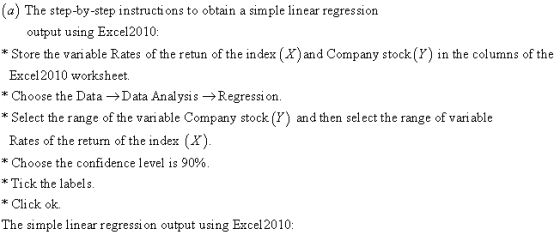
The data in the accompanying table represent the rate of return of a certain company stock for 11 months, compared with the rate of return of a certain index of 500 stocks. Both are in percent. Compl...
The data in the accompanying table represent the rate of return of a certain company stock for 11 months, compared with the rate of return of a certain index of 500 stocks. Both are in percent. Complete parts (a) through (d) below.
Month Rates of return Rates of return of the index-x the company stock-y
Apr-07 4.33 3.38
May-07 3.25 5.09
Jun-07 -1.78 0.54
Jul-07 -3.20 2.88
Aug-07 1.29 2.69
Sept-07 3.58 7.41
Oct-07 1.48 -4.83
Nov-07 -4.40 -2.38
Dec-07 -0.86 2.37
Jan-08 -6.12 -4.27
Feb-08 -3.48 -3.77
(a) Treating the rate of return of the index as the explanatory variable, x, use technology to determine the estimates of β0 and β1.
The estimate of β0 is:
(Round to four decimal places as needed.)
The estimate of β1.is:
(Round to four decimal places as needed.)
(b) Assuming the residuals are normally distributed, test whether a linear relation exists between the rate of return of the index, x, and the rate of return for the company stock, y, at the α =0.10 level of significance.
What is the null and alternative hypotheses?
What is the P-Value for this hypothesis?
(Round to three decimal places as needed.)
What is the conclusion from α =0.10 level of significance? Reject or Accept H0? There is or sufficient evidence to conclude linear relation?
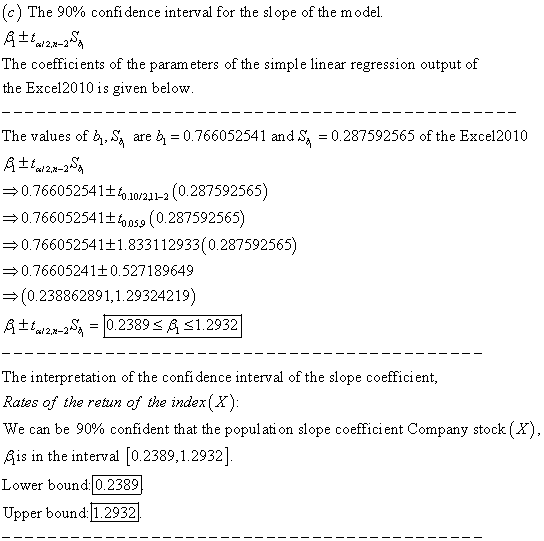
(c) Assuming the residuals are normally distributed, construct a 90% confidence interval for the slope of the true least-squares regression line.
Lower Bound:
(Round to four decimal places as needed.)
Upper Bound:
(Round to four decimal places as needed.)
(d) What is the mean rate of return for the company stock if the rate of return of the index is 3.15%?
(Round to three decimal places as needed.)
Homework Answers

-----------------------------------------------------------------------------------------------------------------------------------------
![The values of the estim ate of the coefficient of slope is £ is of the Excel2010 output is given below A-076605] The values o](http://img.homeworklib.com/images/80a1e1a8-e15c-460b-a239-fdb04563f957.png?x-oss-process=image/resize,w_560)

Add Answer to:
The data in the accompanying table represent the rate of return of a certain company stock for 11 months, compared with the rate of return of a certain index of 500 stocks. Both are in percent. Compl...
The data in the accompanying table represent the rate of return of a certain company stock...
 The
data in the accompanying table represent the rate of return of a
certain company stock for 11 months, compared with the rate of
return of a certain index of 500 stocks.
Assuming the residuals are normally distributed, test whether
linear relation exist between the rate of return of the index, x,
And the rate of return for the company stock, y, at the a=0.10
level of significance.
in Month Apr-18 May-18 Jun-18 Jul-18 Aug-18 Sept-18 Oct-18 Nov-18 Dec-18 Jan-19...
The
data in the accompanying table represent the rate of return of a
certain company stock for 11 months, compared with the rate of
return of a certain index of 500 stocks.
Assuming the residuals are normally distributed, test whether
linear relation exist between the rate of return of the index, x,
And the rate of return for the company stock, y, at the a=0.10
level of significance.
in Month Apr-18 May-18 Jun-18 Jul-18 Aug-18 Sept-18 Oct-18 Nov-18 Dec-18 Jan-19...
Please solve for (a)-(d) below. The data in the accompanying table represent the rate of return...
 Please solve for (a)-(d)
below. The data in the accompanying table represent the rate of return of a certain company stock for 11 months, compared with the rate of return of a certain index of 500 stocks. Both are in percent. Complete parts (a) through Click the icon to view the data table. (a) Treating the rate of return of the index as the explanatory variable, x, use technology to determine the estimates of Bo and B1 The estimate of...
Please solve for (a)-(d)
below. The data in the accompanying table represent the rate of return of a certain company stock for 11 months, compared with the rate of return of a certain index of 500 stocks. Both are in percent. Complete parts (a) through Click the icon to view the data table. (a) Treating the rate of return of the index as the explanatory variable, x, use technology to determine the estimates of Bo and B1 The estimate of...
i Rate of Return Month Rates of return of the Rates of return of the index,...
 i Rate of Return Month Rates of return of the Rates of return of the index, x company stock, y Apr-07 4.23 3.38 May-07 3.25 5.09 Jun-07 - 1.78 0.54 -3.20 2.88 Jul-07 Aug-07 1.29 2.69 Sept-07 3.58 7.41 1.48 -4.83 Oct-07 -4.40 -2.38 Nov-07 2.37 Dec-07 -0.86 -6.12 -4.27 Jan-08 -3.48 Feb-08 -3.77 X The data in the accompanying table represent the rate of return of a certain company stock for 11 months, compared with the rate of return...
I need help with - What is the conclusion that can be drawn? - thank you! As concrete cures, it...
I need help with - What is the conclusion that can be drawn? - thank you! As concrete cures, it gains strength. The following data represent the 7-day and 28-day strength in pounds per square inch (psi) of a certain type of concrete. 7-Day_Strength_(psi)_-_x 28-Day_Strength_(psi)_-_y 3390 5220 3340 4630 2300 4070 2480 4120 3380 5020 (a) Treating the 7-day strength as the explanatory variable, x, use technology to determine the estimates of β0 and β1. β0≈b0= 1981.5 (Round to one...
I need help at the bottom of the page with - A normal probability plot suggests...
I need help at the bottom of the page with - A normal probability plot suggests that the residuals are normally distributed - thank you! A pediatrician wants to determine the relation that may exist between a child's height and head circumference. She randomly selects 5 children and measures their height and head circumference. The data are summarized below. Height_(inches)_-_x Head Circumference_(inches)_-_y 27.5 17.5 27.75 17.6 25.5 17.1 25 16.9 26.5 17.3 (a) Treating height as the explanatory variable, x,...
I need help with - d) Assuming the residuals are normally distributed, test Ho : β1=0 versus H1 ...
I need help with - d) Assuming the residuals are normally distributed, test Ho : β1=0 versus H1 : β1 ≠ 0 at the α = 0.05 level of significance - at the bottom of the page. Thank you! For the data set shown below. x y 20 98 30 95 40 89 50 85 60 72 (a) Use technology to find the estimates of β0 and β1. β0 ≈ b0= 112.6 (Round to two decimal places as needed.) β1...
For the data set shown below, complete parts (a) through (d) below x 20 30 40...
 For the data set shown below, complete parts (a) through (d) below x 20 30 40 50 60e yi 98 95 93 83 70 (a) Use technology to find the estimates of Po and β1 Po b,-□ (Round to two decimal places as needed.) β1 ~ b1-D (Round to two decimal places as needed) (b) Use technology to compute the standard error, the point estimate for σ. Round to four decimal places as needed) (c) Assuming the residuals are normally...
I need help with - (d) Based on your results to parts (b) and (c), would...
I need help with - (d) Based on your results to parts (b) and (c), would you recommend using the least-squares regression line to predict the stock return of a company based on the CEO's compensation? Why? What would be a good estimate of the stock return based on the data in the table? - the final part of the problem. Thank you! The accompanying data represent the total compensation for 12 randomly selected chief executive officers (CEOs) and the...
As concrete cures, it gains strength. The following data represent the 7-day and 28-day strength ...
 As concrete cures, it gains strength. The following data represent the 7-day and 28-day strength in pounds per square inch (psi) ofa certain type of concrete. Complete parts (a) through (f) below. 7-Dy Strength (psi)x 33802620 3390 2300 3330 4070 4850 28-Day Strength (psi,y 4190 (a) Treating the 7-day strength as the explanatory variable, use technology to determine the estimates of Po and pl P 1753.9 (Round to one decimal place as needed.) P sb9707 (Round to four decimal places...
The accompanying data represent the total compensation for 12 randomly selected chief executive officers (CEOs) and...
 The accompanying data represent the total compensation for 12 randomly selected chief executive officers (CEOs) and the company's stock performance. Use the data to complete parts (a) through (d) EEB Click the icon to view the data table (Rouna to one aecimai piace as neeaea.) (b) Assuming that the residuals are normally distributed, test whether a linear relation exists between compensation and stock return at the α: 0.05 level of significance. What are the null and alternative hypotheses? Data Table...
 The
data in the accompanying table represent the rate of return of a
certain company stock for 11 months, compared with the rate of
return of a certain index of 500 stocks.
Assuming the residuals are normally distributed, test whether
linear relation exist between the rate of return of the index, x,
And the rate of return for the company stock, y, at the a=0.10
level of significance.
in Month Apr-18 May-18 Jun-18 Jul-18 Aug-18 Sept-18 Oct-18 Nov-18 Dec-18 Jan-19...
The
data in the accompanying table represent the rate of return of a
certain company stock for 11 months, compared with the rate of
return of a certain index of 500 stocks.
Assuming the residuals are normally distributed, test whether
linear relation exist between the rate of return of the index, x,
And the rate of return for the company stock, y, at the a=0.10
level of significance.
in Month Apr-18 May-18 Jun-18 Jul-18 Aug-18 Sept-18 Oct-18 Nov-18 Dec-18 Jan-19...
 Please solve for (a)-(d)
below. The data in the accompanying table represent the rate of return of a certain company stock for 11 months, compared with the rate of return of a certain index of 500 stocks. Both are in percent. Complete parts (a) through Click the icon to view the data table. (a) Treating the rate of return of the index as the explanatory variable, x, use technology to determine the estimates of Bo and B1 The estimate of...
Please solve for (a)-(d)
below. The data in the accompanying table represent the rate of return of a certain company stock for 11 months, compared with the rate of return of a certain index of 500 stocks. Both are in percent. Complete parts (a) through Click the icon to view the data table. (a) Treating the rate of return of the index as the explanatory variable, x, use technology to determine the estimates of Bo and B1 The estimate of...
 i Rate of Return Month Rates of return of the Rates of return of the index, x company stock, y Apr-07 4.23 3.38 May-07 3.25 5.09 Jun-07 - 1.78 0.54 -3.20 2.88 Jul-07 Aug-07 1.29 2.69 Sept-07 3.58 7.41 1.48 -4.83 Oct-07 -4.40 -2.38 Nov-07 2.37 Dec-07 -0.86 -6.12 -4.27 Jan-08 -3.48 Feb-08 -3.77 X The data in the accompanying table represent the rate of return of a certain company stock for 11 months, compared with the rate of return...
 For the data set shown below, complete parts (a) through (d) below x 20 30 40 50 60e yi 98 95 93 83 70 (a) Use technology to find the estimates of Po and β1 Po b,-□ (Round to two decimal places as needed.) β1 ~ b1-D (Round to two decimal places as needed) (b) Use technology to compute the standard error, the point estimate for σ. Round to four decimal places as needed) (c) Assuming the residuals are normally...
 As concrete cures, it gains strength. The following data represent the 7-day and 28-day strength in pounds per square inch (psi) ofa certain type of concrete. Complete parts (a) through (f) below. 7-Dy Strength (psi)x 33802620 3390 2300 3330 4070 4850 28-Day Strength (psi,y 4190 (a) Treating the 7-day strength as the explanatory variable, use technology to determine the estimates of Po and pl P 1753.9 (Round to one decimal place as needed.) P sb9707 (Round to four decimal places...
 The accompanying data represent the total compensation for 12 randomly selected chief executive officers (CEOs) and the company's stock performance. Use the data to complete parts (a) through (d) EEB Click the icon to view the data table (Rouna to one aecimai piace as neeaea.) (b) Assuming that the residuals are normally distributed, test whether a linear relation exists between compensation and stock return at the α: 0.05 level of significance. What are the null and alternative hypotheses? Data Table...
Most questions answered within 3 hours.
-
Write a psudocode:
1. Define a function called authorize that takes in 2 strings,
uName, and...
asked 43 seconds from now -
What mass of ethylene glycol (C2H6O2) must be added to 211.0 g
of water to obtain...
asked 44 seconds ago -
Mary's employer has a defined benefits retirement plan, which
pay 3.2% of her last year's salary...
asked 4 minutes ago -
What are the characteristics and behavior of an ethical
manager?
Explain, in your words, what ethics...
asked 20 minutes ago -
1. Which of the following is NOT an argument that McMahan uses
to show that jus...
asked 41 minutes ago -
A crate slides up a frictionless slope. At the end of 3 seconds
its velocity is...
asked 59 minutes ago -
Use the following information to answer the next seven
questions.
Suppose there are three potential states...
asked 54 minutes ago -
If we only have interstitial and substitutional diffusion, then
what do we consider the process of...
asked 1 hour ago -
You look at yourself in a shiny 9.6-cm-diameter Christmas tree
ball.
If your face is 21.0...
asked 1 hour ago -
If we were to measure the relaxation time of a muscle after
undergoing tetanus compared to...
asked 1 hour ago -
4CO(g) + 8H2(g) -----> 3CH4(g) +
CO2(g) + 2H2O(l)
Use the following data as needed to...
asked 1 hour ago -
without using map
1. Write a C++ program to find out the top 10 words in...
asked 1 hour ago