

Response y Effect Summary Regression Plot Summary of Fit Analysis of Variance Sum of Source DF Squares Mean Square F Ratio Model 1 775.48219 Error C Total16 816.23529 775 482 285.4318 2.717 Prob > F 0001 5 40.75311 D Lack Of Fit 4 Parameter Estimates Term Estimate Std Error tRatio Prob>lt Intercept-40.03296 3.250743-1232 .0001 x1 0.943544 0.055848 16.89 F Source Model Error C Total16 816.23529 DF 2 793.97486 14 22.26043 ,0001 Lack Of Fit 4 Parameter Estimates Term Estimate Std Error t Ratio Prob> It Intercept -42.00131 2.552956-1645
Homework Answers
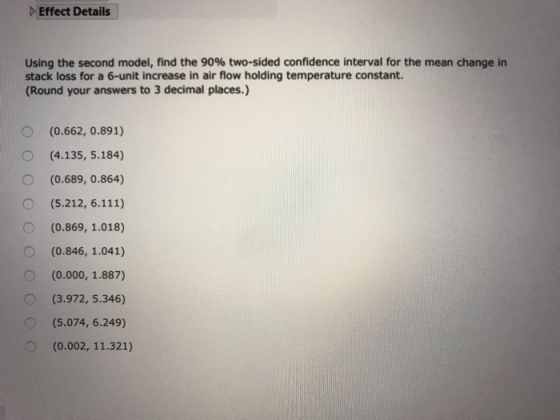
| b1^ | se(b1^) | t | lower | upper |
| 0.776504 | 0.064996 | 1.76131 | 0.662025 | 0.890982 |
| 3.972153 | 5.34589 |
formula
| b1^ | se(b1^) | t | lower | upper |
| 0.7765036 | 0.064996 | =T.INV.2T(0.1,14) | =A2-C2*B2 | =A2+C2*B2 |
| =6*D2 | =6*E2 |
hence
(3.972,5.346)
third last option is correct
Please rate
Add Answer to:
Please answer asap, thanks! We collect the following data to study the operation of a plant for the oxidation of ammonia to nitric acid. In the regression models, x is air flow, x2 is cooling w...
I think I am reading into the question to much. Would I just do x=10 and plug it into the least s...
 I think I am reading into the question to much. Would I just do
x=10 and plug it into the least square equation?
Bivariate Fit of ls2 By pyr2 1.0 0.9 0.8 Is2 0.7 0.6 0.5 0.4 30 40 50 10 0 20 60 70 pyr2 Linear Fit Linear Fit Is2 - 0.8044313 - 0.0016504 pyr2 Summary of Fit RSquare RSquare Adj Root Mean Square Error Mean of Response Observations (or Sum Wgts) 0.031661 0.006831 0.137003 0.759024 Lack Of Fit...
I think I am reading into the question to much. Would I just do
x=10 and plug it into the least square equation?
Bivariate Fit of ls2 By pyr2 1.0 0.9 0.8 Is2 0.7 0.6 0.5 0.4 30 40 50 10 0 20 60 70 pyr2 Linear Fit Linear Fit Is2 - 0.8044313 - 0.0016504 pyr2 Summary of Fit RSquare RSquare Adj Root Mean Square Error Mean of Response Observations (or Sum Wgts) 0.031661 0.006831 0.137003 0.759024 Lack Of Fit...
LA Real Estate Data. On a particular day in the spring, there were several properties for...
 LA Real Estate Data. On a particular day in the spring, there were several properties for sale in Los Angeles. The dataset LARealEstate.xlsx on Blackboard contains the data used for this analysis (See Exhibit 1 for output). The relevant variables for this analysis are: 1. List Price: Saft Price the property is currently listed for Square footage of the living space To create the output yourself: .Excel: Data - Data Analysis- Regression, select the Y and X columns, including variable...
QUESTION 19 For the following software output, check each assumption/condition to run linear regression and state...
 QUESTION 19 For the following software output, check each assumption/condition to run linear regression and state whether it is appropriate to use linear regression. Bivariate Fit of pluto By alpha 20 15 10 5 0 e 0.05 0.15 C 0.1 alpha Linear Fit Linear Fit pluto -0.597417 16543195*alpha Summary of Fit RSquare RSquare Adj Root Mean Square Error Mean of Response Observations (or Sum Wgts) 0.915999 0.911999 2.172963 6.73913 23 Analysis of Variance Sum of DF Squares Mean Square Source...
Bivariate Fit of NONFOOD PURCHASES By AGE 90 80 70 60 50 40 30 20 20...
 Bivariate Fit of NONFOOD PURCHASES By AGE 90 80 70 60 50 40 30 20 20 30 40 50 60 AGE -Linear Fit Linear Fit NONFOOD_PURCHASES = 12.956633 0.8136836 AGE Summary of Fit RSquare RSquare Adj Root Mean Square Error Mean of Response Observations (or Sum Wgts) 0.33852 0.336478 11.54086 39.1842 326 Lack Of Fit Analysis of Variance Sum of Source DF Squares Mean Square F Ratio 22084.6 165.8106 133.2 Prob > F .00011 Model 1 22084.562 Error 324 43154.032...
I need help interpreting logistic regression results to answer the following question: Does GRE scores, undergraduate...
 I need help interpreting logistic regression results to answer
the following question: Does GRE scores, undergraduate GPA and the
prestige (yes or no) of their undergraduate program effect
admission (yes or no) into graduate school?
Fit Group 4 Logistic Fit of ADMIT 2 By GRE 1.00 Contingency Analysis of ADMIT 2 By TOPNOTCH 2 4 Mosaic Plot Logistic Fit of ADMIT 2 By GPA 1.00 1.00 0.75 0.75 No 0.75 No No ADMIT 2 0.50 N 0.50 ADMIT 2 ADMIT...
I need help interpreting logistic regression results to answer
the following question: Does GRE scores, undergraduate GPA and the
prestige (yes or no) of their undergraduate program effect
admission (yes or no) into graduate school?
Fit Group 4 Logistic Fit of ADMIT 2 By GRE 1.00 Contingency Analysis of ADMIT 2 By TOPNOTCH 2 4 Mosaic Plot Logistic Fit of ADMIT 2 By GPA 1.00 1.00 0.75 0.75 No 0.75 No No ADMIT 2 0.50 N 0.50 ADMIT 2 ADMIT...
Also: Based on the regression results, solve for the predicted MPGavg for 8 cylinder cars. and Based on the regression...
 Also:
Based on the regression results, solve for the predicted
MPGavg for 8 cylinder cars.
and
Based on the regression results, what is the best answer
concerning average MPG for 4 cylinder SUVs.
a. 4 cylinder SUVs have statistically higher average MPG when
compared to 8 cylinder SUVs.
b. The number of cylinders does not help explain average
MPG.
c. 6 cylinder SUVs do not have statistically higher average MPG
when compared to 8 cylinder SUVs.
d. 4 cylinder SUVs...
Also:
Based on the regression results, solve for the predicted
MPGavg for 8 cylinder cars.
and
Based on the regression results, what is the best answer
concerning average MPG for 4 cylinder SUVs.
a. 4 cylinder SUVs have statistically higher average MPG when
compared to 8 cylinder SUVs.
b. The number of cylinders does not help explain average
MPG.
c. 6 cylinder SUVs do not have statistically higher average MPG
when compared to 8 cylinder SUVs.
d. 4 cylinder SUVs...
Please use Excel, and show all functions. 3. Answer the following question for where Y has...
 Please use Excel, and show all functions.
3. Answer the following question for where Y has been regressed on X1, X2, and X3. Use the linear regression output in the Excel file. Your answers should be rounded to 2 decimal places. a. What is the equation for the line of best fit or regression line? b. The proportion is for the amount of the variability of Y that is explained or accounted for by the model. C. The correlation between...
Please use Excel, and show all functions.
3. Answer the following question for where Y has been regressed on X1, X2, and X3. Use the linear regression output in the Excel file. Your answers should be rounded to 2 decimal places. a. What is the equation for the line of best fit or regression line? b. The proportion is for the amount of the variability of Y that is explained or accounted for by the model. C. The correlation between...
X Part I. Derive Bivariate Regression by hand. Again, we are using the same data set that we used in the in-cl...
 X Part I. Derive Bivariate Regression by hand. Again, we are using the same data set that we used in the in-class assessment. Case Dietary Fat Body Fat 22 9.8 22 11.7 14 8.0 21 9.7 32 10.9 26 7.8 30 21 17 1. Step 1: Find the mean of dietary fat x = 2. Step 2: Find the mean of body fat y = 3. Step 3: Find the sum of (x1 - x)y- y) = 3316 4. Step...
8. A statistics professor was considering the purchase of a Debonair Beechcraft and collected the data...
 8. A statistics professor was considering the purchase of a Debonair Beechcraft and collected the data shown below the questions from Trade-A-Plane magazine. He ran a regression using year as the predictor and price as the response variable. a. Write the estimated least squares regression equation. b. Conduct an individual t-test for Ho: Bi= 0 vs Hi: B1 = 0 at the a = 0.05 level. c. What is the 95% CI for Bı? How are the test and CI...
1. For each of the following regression models, write down the X matrix and 3 vector....
 1. For each of the following regression models, write down the X matrix and 3 vector. Assume in both cases that there are four observations (a) Y BoB1X1 + B2X1X2 (b) log Y Bo B1XiB2X2+ 2. For each of the following regression models, write down the X matrix and vector. Assume in both cases that there are five observations. (a) YB1XB2X2+BXE (b) VYBoB, X,a +2 log10 X2+E regression model never reduces R2, why 3. If adding predictor variables to a...
 I think I am reading into the question to much. Would I just do
x=10 and plug it into the least square equation?
Bivariate Fit of ls2 By pyr2 1.0 0.9 0.8 Is2 0.7 0.6 0.5 0.4 30 40 50 10 0 20 60 70 pyr2 Linear Fit Linear Fit Is2 - 0.8044313 - 0.0016504 pyr2 Summary of Fit RSquare RSquare Adj Root Mean Square Error Mean of Response Observations (or Sum Wgts) 0.031661 0.006831 0.137003 0.759024 Lack Of Fit...
I think I am reading into the question to much. Would I just do
x=10 and plug it into the least square equation?
Bivariate Fit of ls2 By pyr2 1.0 0.9 0.8 Is2 0.7 0.6 0.5 0.4 30 40 50 10 0 20 60 70 pyr2 Linear Fit Linear Fit Is2 - 0.8044313 - 0.0016504 pyr2 Summary of Fit RSquare RSquare Adj Root Mean Square Error Mean of Response Observations (or Sum Wgts) 0.031661 0.006831 0.137003 0.759024 Lack Of Fit...
 LA Real Estate Data. On a particular day in the spring, there were several properties for sale in Los Angeles. The dataset LARealEstate.xlsx on Blackboard contains the data used for this analysis (See Exhibit 1 for output). The relevant variables for this analysis are: 1. List Price: Saft Price the property is currently listed for Square footage of the living space To create the output yourself: .Excel: Data - Data Analysis- Regression, select the Y and X columns, including variable...
 QUESTION 19 For the following software output, check each assumption/condition to run linear regression and state whether it is appropriate to use linear regression. Bivariate Fit of pluto By alpha 20 15 10 5 0 e 0.05 0.15 C 0.1 alpha Linear Fit Linear Fit pluto -0.597417 16543195*alpha Summary of Fit RSquare RSquare Adj Root Mean Square Error Mean of Response Observations (or Sum Wgts) 0.915999 0.911999 2.172963 6.73913 23 Analysis of Variance Sum of DF Squares Mean Square Source...
 Bivariate Fit of NONFOOD PURCHASES By AGE 90 80 70 60 50 40 30 20 20 30 40 50 60 AGE -Linear Fit Linear Fit NONFOOD_PURCHASES = 12.956633 0.8136836 AGE Summary of Fit RSquare RSquare Adj Root Mean Square Error Mean of Response Observations (or Sum Wgts) 0.33852 0.336478 11.54086 39.1842 326 Lack Of Fit Analysis of Variance Sum of Source DF Squares Mean Square F Ratio 22084.6 165.8106 133.2 Prob > F .00011 Model 1 22084.562 Error 324 43154.032...
 I need help interpreting logistic regression results to answer
the following question: Does GRE scores, undergraduate GPA and the
prestige (yes or no) of their undergraduate program effect
admission (yes or no) into graduate school?
Fit Group 4 Logistic Fit of ADMIT 2 By GRE 1.00 Contingency Analysis of ADMIT 2 By TOPNOTCH 2 4 Mosaic Plot Logistic Fit of ADMIT 2 By GPA 1.00 1.00 0.75 0.75 No 0.75 No No ADMIT 2 0.50 N 0.50 ADMIT 2 ADMIT...
I need help interpreting logistic regression results to answer
the following question: Does GRE scores, undergraduate GPA and the
prestige (yes or no) of their undergraduate program effect
admission (yes or no) into graduate school?
Fit Group 4 Logistic Fit of ADMIT 2 By GRE 1.00 Contingency Analysis of ADMIT 2 By TOPNOTCH 2 4 Mosaic Plot Logistic Fit of ADMIT 2 By GPA 1.00 1.00 0.75 0.75 No 0.75 No No ADMIT 2 0.50 N 0.50 ADMIT 2 ADMIT...
 Also:
Based on the regression results, solve for the predicted
MPGavg for 8 cylinder cars.
and
Based on the regression results, what is the best answer
concerning average MPG for 4 cylinder SUVs.
a. 4 cylinder SUVs have statistically higher average MPG when
compared to 8 cylinder SUVs.
b. The number of cylinders does not help explain average
MPG.
c. 6 cylinder SUVs do not have statistically higher average MPG
when compared to 8 cylinder SUVs.
d. 4 cylinder SUVs...
Also:
Based on the regression results, solve for the predicted
MPGavg for 8 cylinder cars.
and
Based on the regression results, what is the best answer
concerning average MPG for 4 cylinder SUVs.
a. 4 cylinder SUVs have statistically higher average MPG when
compared to 8 cylinder SUVs.
b. The number of cylinders does not help explain average
MPG.
c. 6 cylinder SUVs do not have statistically higher average MPG
when compared to 8 cylinder SUVs.
d. 4 cylinder SUVs...
 Please use Excel, and show all functions.
3. Answer the following question for where Y has been regressed on X1, X2, and X3. Use the linear regression output in the Excel file. Your answers should be rounded to 2 decimal places. a. What is the equation for the line of best fit or regression line? b. The proportion is for the amount of the variability of Y that is explained or accounted for by the model. C. The correlation between...
Please use Excel, and show all functions.
3. Answer the following question for where Y has been regressed on X1, X2, and X3. Use the linear regression output in the Excel file. Your answers should be rounded to 2 decimal places. a. What is the equation for the line of best fit or regression line? b. The proportion is for the amount of the variability of Y that is explained or accounted for by the model. C. The correlation between...
 X Part I. Derive Bivariate Regression by hand. Again, we are using the same data set that we used in the in-class assessment. Case Dietary Fat Body Fat 22 9.8 22 11.7 14 8.0 21 9.7 32 10.9 26 7.8 30 21 17 1. Step 1: Find the mean of dietary fat x = 2. Step 2: Find the mean of body fat y = 3. Step 3: Find the sum of (x1 - x)y- y) = 3316 4. Step...
 8. A statistics professor was considering the purchase of a Debonair Beechcraft and collected the data shown below the questions from Trade-A-Plane magazine. He ran a regression using year as the predictor and price as the response variable. a. Write the estimated least squares regression equation. b. Conduct an individual t-test for Ho: Bi= 0 vs Hi: B1 = 0 at the a = 0.05 level. c. What is the 95% CI for Bı? How are the test and CI...
 1. For each of the following regression models, write down the X matrix and 3 vector. Assume in both cases that there are four observations (a) Y BoB1X1 + B2X1X2 (b) log Y Bo B1XiB2X2+ 2. For each of the following regression models, write down the X matrix and vector. Assume in both cases that there are five observations. (a) YB1XB2X2+BXE (b) VYBoB, X,a +2 log10 X2+E regression model never reduces R2, why 3. If adding predictor variables to a...
Most questions answered within 3 hours.
-
Linear programming is an excellent technique yet is not applied
nearly enough in the “real world.”...
asked 6 minutes ago -
What three alkenes yield 3-methylpentane on catalytic
hydrogenation?
asked 6 minutes ago -
In JAVA Create a program with an array with the following
data:
50 12 31 76...
asked 8 minutes ago -
Using a hormone of the hypothalamic-anterior pituitary axis,
describe or diagram how negative feedback loops regulate...
asked 6 minutes ago -
1,1-dimethylcyclorohexane reacts with single bromine atom
asked 29 minutes ago -
The completed Lewis structure of CO2 contains a total
of 0,1,2,3,4,5,6,7,8 covalent bonds
and 0,1,2,3,4,5,6,7,8 lone pairs.
NOTE:...
asked 36 minutes ago -
A 0.0510 M solution of an organic acid has an
[H+] of 7.50×10⁻⁴M .
What is...
asked 33 minutes ago -
what is the profit-maximizing output condition that a
monopolistically competitive firm must satisfy? a) price charged...
asked 37 minutes ago -
Consider the set of ordered pairs shown below. Assuming that the
regression equation is y=3.513+0.429x and...
asked 59 minutes ago -
1. (A) Write two
structural (constitutional)
isomers of C4H8F2?
Please show all of
the
asked 1 hour ago -
Objective: Practice converting a Boolean logic
expression into it’s truth table and to show the implementation...
asked 58 minutes ago -
1) Name the three holes located in the greater wing of the
sphenoid bone in order...
asked 1 hour ago