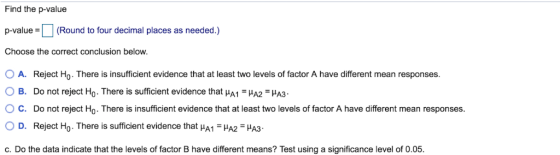
Find the p-value p-value-(Round to four decimal places as needed.) Choose the correct conclusion below 0 A. Reject Ho. There is insufficient evidence that at least two levels of factor A have different mean responses. 0 B. Do not reject Ho . There is sufficient evidence that μΑΙ-μΑ2-μΑ3. O c. Do not reject Ho . There is insufficient evidence that at least two levels of factor A have different mean responses. 0 D. Reject Ho . There is sufficient evidence that μΑι-μΑ2 A3- c. Do the data indicate that the levels of factor B have different means? Test using a significance level of 0.05
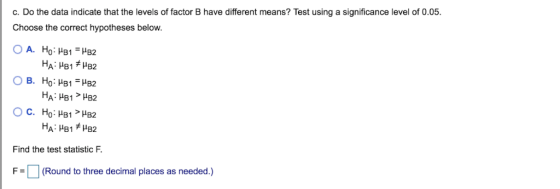
c. Do the data indicate that the levels of factor B have different means? Test using a significance level of 0.05. Choose the correct hypotheses below. O A. Find the test statistic F. F(Round to three decimal places as needed.)
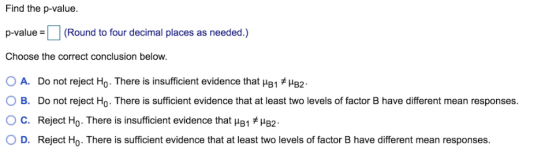
Find the p-value. p-value (Round to four decimal places as needed.) Choose the correct conclusion below 0 A. Do not reject Ho . There is insufficient evidence that μΒ1 μΒ2. O B. Do not reject Ho. There is sufficient evidence that at least two levels of factor B have different mean responses. ° C. Reject Ho . There is insufficient evidence that μΒΙ Έλ D. Reject Ho. There is sufficient evidence that at least two levels of factor B have different mean responses.
Homework Answers
Applying one way ANOVA
b) option A is correct
test statistics F =2.583
p value =0.1167
option C is correct
c)
option A is correct
test statistics F =5.576
p value =0.0360
option D is correct
Add Answer to:
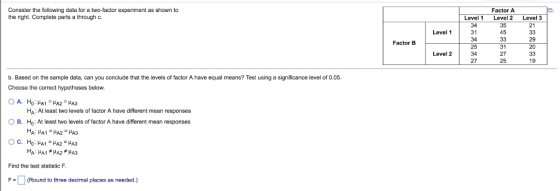
Consider the following data for a two-factor experiment as shown to the right. Complete parts a through c Factor A Level1 Le Level 3 34 31 34 25 Level 2 34 27 21 Level 1 45 Factor B 31 27 25 19 b. Ba...
Please round to 3 decimal places Consider the accompanying data collected for a two-way ANOVA Click...
 Please round to 3 decimal places
Consider the accompanying data collected for a two-way ANOVA Click the icon to view the data table a) Using a b) Using c) Using a 0.025, are the Factor B means different? = 0.025, is there significant interaction between Factors A and B? a = 0.025, are the Factor A means different? a) Using a 0.025, is there significant interaction between Factors A and B? Identify the hypotheses for the interaction between Factors A...
Please round to 3 decimal places
Consider the accompanying data collected for a two-way ANOVA Click the icon to view the data table a) Using a b) Using c) Using a 0.025, are the Factor B means different? = 0.025, is there significant interaction between Factors A and B? a = 0.025, are the Factor A means different? a) Using a 0.025, is there significant interaction between Factors A and B? Identify the hypotheses for the interaction between Factors A...
Use the accompanying partially completed two-way ANOVA summary table to complete parts a through e below....
 Use the accompanying partially completed two-way ANOVA summary table to complete parts a through e below. Click the icon to view the table a) Complete the two-way ANOVA table below. Sum of Degrees of Mean Sum of Source Squares Freedom Squares Factor A 140 Factor B Interaction 20 Error 360 Total 600 44 (Type integers or decimals.) b) How many replications are present for each cell? c) Using c = 0.01, is there significant interaction between Factors A and B?...
4. Use the ANOVA summary table to complete parts (a) through (c) below. Source Degrees of...
 4. Use the ANOVA summary table to complete parts (a) through (c) below. Source Degrees of Freedom Mean Square (Variance) 60 Sum of Squares 300 200 6,000 2,160 8,660 NWT AB 25 240 108 20 Error Total 143 a. At the 0.05 level of significance, is there an effect due to factor A? Determine the hypotheses. Choose the correct answer below. O A. Ho: There is no effect due to factor A. Hy: There is a positive effect due to...
19 25 The sample of six measurements shown below was randomly selected from a normally distributed...
 19 25 The sample of six measurements shown below was randomly selected from a normally distributed population. Complete parts a through c. 1,2,3,3,4,1 a. Test the null hypothesis that the mean of the population is 3 against the alternative hypothesis. p < 3. Use a = 0.05 Ifq=0.05, find the rejection region for the test. Choose the correct answer below. % 1994 1994 OA. <-2015 or t> 2015 Oct-2571 O E. > 2571 OB < -2015 OD < -2571 ort...
A survey investigated how many pounds heavier respondents were than their perceived ideal weight. Consider the...
 A survey investigated how many pounds heavier respondents were than their perceived ideal weight. Consider the following data for the two-factor experiment as shown to the right. Complete parts a through c. Gender Men West 15 13 19 13 Region Midwest South Northeast 20 19 18 16 20 15 24 19 17 20 13 18 Women a. Determine if there is interaction between Region and Gender. Use the p-value approach and a significance level of 0.05 Find the hypotheses. Choose...
The sample of six measurements shown below was randomly selected from a normally distributed population. Complete...
 The sample of six measurements shown below was randomly selected from a normally distributed population. Complete parts a throughc 1,3, 1, 5, 1,2 a. Test the null hypothesis that the mean of the population is 3 against the alternative hypothesis, 3. Use a 0.10. If a = 0.10, find the rejection region for the test. Choose the correct answer below O A. t 2.015 or t> 2.015 O C. t-2015 O E. t1476 O B. t-1.476 O D. t 1.476...
11. Assume that the differences are normally distributed. Complete parts (a) through (d) below. Observation X...
 11. Assume that the differences are normally distributed. Complete parts (a) through (d) below. Observation X Y 1 52.6 53.3 2 52.5 3 44.4 4 44.0 48.4 5 55.1 6 464 7 478 50.5 B 50.4 52.6 51.8 49.5 54.3 49.2 (a) Determine d = XY, for each pair of data. 2 5 6 7 Observation d (Type integers or decimals.) (b) Computed and s. (Round to three decimal places as needed.) Sa (Round to three decimal places as needed.)...
A survey investigated how many pounds heavier respondents were than their perceived ideal weight. Consider the...
 A survey investigated how many pounds heavier respondents were than their perceived ideal weight. Consider the following data for the two-factor experiment as shown to the right. Complete parts a through a. Determine if there is interaction between Region and Gender. Use the p-value approach and a significance le Find the hypotheses. Choose the correct answer below. O A. Ho Region and Gender do not interact to affect the mean response HA Region and Gender do interact to affect the...
Given the null and alternative hypotheses and sample information shown below, complete parts a and b....
 Given the null and alternative hypotheses and sample information
shown below, complete parts a and b.
Can you please check the answers and show the steps?
Given the null and alternative hypotheses and sample information shown below, complete parts a and b. Ho: 07 = 63 HA: 0; #o2 Sample 1 n = 12 Sy = 13 Sample 2 n2 = 21 Sy = 34 a. If a=0.05, state the decision rule for the hypothesis. If the calculated test statistic...
Given the null and alternative hypotheses and sample information
shown below, complete parts a and b.
Can you please check the answers and show the steps?
Given the null and alternative hypotheses and sample information shown below, complete parts a and b. Ho: 07 = 63 HA: 0; #o2 Sample 1 n = 12 Sy = 13 Sample 2 n2 = 21 Sy = 34 a. If a=0.05, state the decision rule for the hypothesis. If the calculated test statistic...
Assume that the differences are normally distributed. Complete parts (a) through (d) below. 9 Observation X;...
 Assume that the differences are normally distributed. Complete parts (a) through (d) below. 9 Observation X; 1 46.2 47.8 2 54.6 54.3 3 46.0 51.1 4 45.7 50.8 5 42.6 45.2 6 50.4 50.1 7 45.4 49.2 8 45.0 47.6 (a) Determine d; = x; -Y; for each pair of data. Observation 1 2 0 0 (Type integers or decimals.) 3 0 4 0 5 0 6 0 7 0 8 0 (b) Computed and sd. und to three decimal...
 Please round to 3 decimal places
Consider the accompanying data collected for a two-way ANOVA Click the icon to view the data table a) Using a b) Using c) Using a 0.025, are the Factor B means different? = 0.025, is there significant interaction between Factors A and B? a = 0.025, are the Factor A means different? a) Using a 0.025, is there significant interaction between Factors A and B? Identify the hypotheses for the interaction between Factors A...
Please round to 3 decimal places
Consider the accompanying data collected for a two-way ANOVA Click the icon to view the data table a) Using a b) Using c) Using a 0.025, are the Factor B means different? = 0.025, is there significant interaction between Factors A and B? a = 0.025, are the Factor A means different? a) Using a 0.025, is there significant interaction between Factors A and B? Identify the hypotheses for the interaction between Factors A...
 Use the accompanying partially completed two-way ANOVA summary table to complete parts a through e below. Click the icon to view the table a) Complete the two-way ANOVA table below. Sum of Degrees of Mean Sum of Source Squares Freedom Squares Factor A 140 Factor B Interaction 20 Error 360 Total 600 44 (Type integers or decimals.) b) How many replications are present for each cell? c) Using c = 0.01, is there significant interaction between Factors A and B?...
 4. Use the ANOVA summary table to complete parts (a) through (c) below. Source Degrees of Freedom Mean Square (Variance) 60 Sum of Squares 300 200 6,000 2,160 8,660 NWT AB 25 240 108 20 Error Total 143 a. At the 0.05 level of significance, is there an effect due to factor A? Determine the hypotheses. Choose the correct answer below. O A. Ho: There is no effect due to factor A. Hy: There is a positive effect due to...
 19 25 The sample of six measurements shown below was randomly selected from a normally distributed population. Complete parts a through c. 1,2,3,3,4,1 a. Test the null hypothesis that the mean of the population is 3 against the alternative hypothesis. p < 3. Use a = 0.05 Ifq=0.05, find the rejection region for the test. Choose the correct answer below. % 1994 1994 OA. <-2015 or t> 2015 Oct-2571 O E. > 2571 OB < -2015 OD < -2571 ort...
 A survey investigated how many pounds heavier respondents were than their perceived ideal weight. Consider the following data for the two-factor experiment as shown to the right. Complete parts a through c. Gender Men West 15 13 19 13 Region Midwest South Northeast 20 19 18 16 20 15 24 19 17 20 13 18 Women a. Determine if there is interaction between Region and Gender. Use the p-value approach and a significance level of 0.05 Find the hypotheses. Choose...
 The sample of six measurements shown below was randomly selected from a normally distributed population. Complete parts a throughc 1,3, 1, 5, 1,2 a. Test the null hypothesis that the mean of the population is 3 against the alternative hypothesis, 3. Use a 0.10. If a = 0.10, find the rejection region for the test. Choose the correct answer below O A. t 2.015 or t> 2.015 O C. t-2015 O E. t1476 O B. t-1.476 O D. t 1.476...
 11. Assume that the differences are normally distributed. Complete parts (a) through (d) below. Observation X Y 1 52.6 53.3 2 52.5 3 44.4 4 44.0 48.4 5 55.1 6 464 7 478 50.5 B 50.4 52.6 51.8 49.5 54.3 49.2 (a) Determine d = XY, for each pair of data. 2 5 6 7 Observation d (Type integers or decimals.) (b) Computed and s. (Round to three decimal places as needed.) Sa (Round to three decimal places as needed.)...
 A survey investigated how many pounds heavier respondents were than their perceived ideal weight. Consider the following data for the two-factor experiment as shown to the right. Complete parts a through a. Determine if there is interaction between Region and Gender. Use the p-value approach and a significance le Find the hypotheses. Choose the correct answer below. O A. Ho Region and Gender do not interact to affect the mean response HA Region and Gender do interact to affect the...
 Given the null and alternative hypotheses and sample information
shown below, complete parts a and b.
Can you please check the answers and show the steps?
Given the null and alternative hypotheses and sample information shown below, complete parts a and b. Ho: 07 = 63 HA: 0; #o2 Sample 1 n = 12 Sy = 13 Sample 2 n2 = 21 Sy = 34 a. If a=0.05, state the decision rule for the hypothesis. If the calculated test statistic...
Given the null and alternative hypotheses and sample information
shown below, complete parts a and b.
Can you please check the answers and show the steps?
Given the null and alternative hypotheses and sample information shown below, complete parts a and b. Ho: 07 = 63 HA: 0; #o2 Sample 1 n = 12 Sy = 13 Sample 2 n2 = 21 Sy = 34 a. If a=0.05, state the decision rule for the hypothesis. If the calculated test statistic...
 Assume that the differences are normally distributed. Complete parts (a) through (d) below. 9 Observation X; 1 46.2 47.8 2 54.6 54.3 3 46.0 51.1 4 45.7 50.8 5 42.6 45.2 6 50.4 50.1 7 45.4 49.2 8 45.0 47.6 (a) Determine d; = x; -Y; for each pair of data. Observation 1 2 0 0 (Type integers or decimals.) 3 0 4 0 5 0 6 0 7 0 8 0 (b) Computed and sd. und to three decimal...
Most questions answered within 3 hours.
-
What kind of materials are found in Leviticus? Give a simple
description of this book. Also...
asked 1 minute ago -
17.1 Energy drink commercials. A study was designed to compare
Red Bull energy drink commercials. Each...
asked 4 minutes ago -
The life that maximizes net present value and shareholder wealth
is known as...
Physical Life
Economic...
asked 28 minutes ago -
You have to write your code in C++ (as a cpp file) and prepare a
docx...
asked 1 hour ago -
Why does the spectrum of bromocresol green changes at different
pHs? What causes the change?
asked 1 hour ago -
Rice Company has a unit selling price of $690, variable costs
per unit of $390, and...
asked 2 hours ago -
The DeVille Company reported pretax accounting
income on its income statement as follows:
2018
$
425,000...
asked 2 hours ago -
Argue for or against the "Three Strikes"laws. Provide a rationale
to support your response.
asked 3 hours ago -
Bargaining Models: what is the "Obsolescing Bargain"?
Bargaining Models: what are the factors that would tend...
asked 4 hours ago -
1. A ball is thrown up into the air.
a) Draw motion diagram and the point-like...
asked 4 hours ago -
1) Because money eliminates the "double coincidence of wants"
problem, the development of money as a...
asked 4 hours ago -
Company AAA produces only one product which other manufacturers
purchase as a component for their final...
asked 7 hours ago