

Homework Answers
excel output-
| Anova: Two-Factor With Replication | ||||||
| SUMMARY | level 1 | level2 | level3 | Total | ||
| level1 | ||||||
| Count | 3 | 3 | 3 | 9 | ||
| Sum | 28 | 41 | 62 | 131 | ||
| Average | 9.333333 | 13.66667 | 20.66667 | 14.55556 | ||
| Variance | 26.33333 | 22.33333 | 94.33333 | 60.27778 | ||
| level2 | ||||||
| Count | 3 | 3 | 3 | 9 | ||
| Sum | 53 | 74 | 93 | 220 | ||
| Average | 17.66667 | 24.66667 | 31 | 24.44444 | ||
| Variance | 74.33333 | 41.33333 | 37 | 71.52778 | ||
| level3 | ||||||
| Count | 3 | 3 | 3 | 9 | ||
| Sum | 95 | 107 | 106 | 308 | ||
| Average | 31.66667 | 35.66667 | 35.33333 | 34.22222 | ||
| Variance | 72.33333 | 44.33333 | 21.33333 | 38.19444 | ||
| Total | ||||||
| Count | 9 | 9 | 9 | |||
| Sum | 176 | 222 | 261 | |||
| Average | 19.55556 | 24.66667 | 29 | |||
| Variance | 138.7778 | 117.75 | 80.75 | |||
| ANOVA | ||||||
| Source of Variation | SS | df | MS | F | P-value | F crit |
| Sample | 1740.519 | 2 | 870.2593 | 18.06072 | 4.98E-05 | 3.554557 |
| Columns | 402.2963 | 2 | 201.1481 | 4.174481 | 0.032403 | 3.554557 |
| Interaction | 90.37037 | 4 | 22.59259 | 0.46887 | 0.757862 | 2.927744 |
| Within | 867.3333 | 18 | 48.18519 | |||
| Total | 3100.519 | 26 | ||||
a)
Ho: factors A and B do not interact
H1: factor A and B do interact
p value=0.758
do not reject Ho, there is insufficient evidence to conclude that
factors A and B interact
b)
Ho: µA1=µA2=µA3; H1: not all factor A means are equal
p value for factor A=0.032
so,
do not reject null hypothesis, there is insufficient evidence to
conclude that not all factor A means are equal
c)
Ho: µB1=µB2=µB3; H1: not all factor B means are equal
p value for factor B=0.000 <α
So,
reject null hypothesis, there is sufficient evidence to conclude
that not all factor B means are equal
Add Answer to:
Please round to 3 decimal places
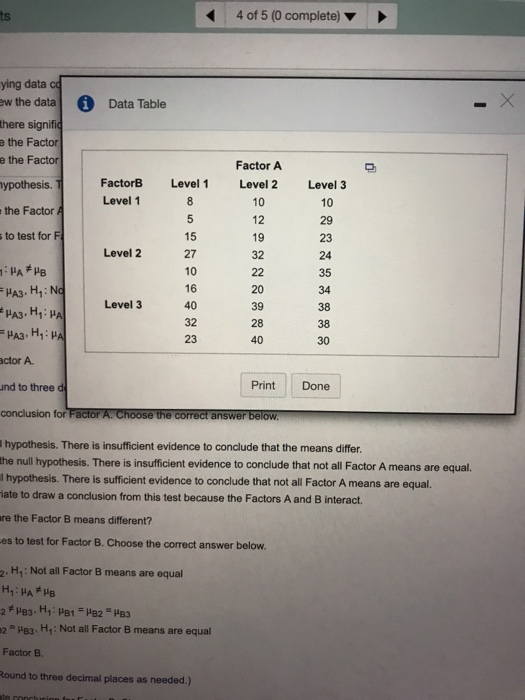
Consider the accompanying data collected for a two-way ANOVA Click...
Use the accompanying partially completed two-way ANOVA summary table to complete parts a through e below....
 Use the accompanying partially completed two-way ANOVA summary table to complete parts a through e below. Click the icon to view the table a) Complete the two-way ANOVA table below. Sum of Degrees of Mean Sum of Source Squares Freedom Squares Factor A 140 Factor B Interaction 20 Error 360 Total 600 44 (Type integers or decimals.) b) How many replications are present for each cell? c) Using c = 0.01, is there significant interaction between Factors A and B?...
A company produces a single product on three production lines that use different equipment. The production...
 A company produces a single product on three production lines
that use different equipment. The production manager is considering
changing the layouts of the lines and would like to know what
effects different layouts would have on production output. Suppose
that the manager measured the average output for each line over
three randomly selected weeks using each of the three layouts under
consideration. The output (in hundreds of units produced) was
measured for each line for each of the four...
A company produces a single product on three production lines
that use different equipment. The production manager is considering
changing the layouts of the lines and would like to know what
effects different layouts would have on production output. Suppose
that the manager measured the average output for each line over
three randomly selected weeks using each of the three layouts under
consideration. The output (in hundreds of units produced) was
measured for each line for each of the four...
A survey investigated how many pounds heavier respondents were than their perceived ideal weight. Consider the...
 A survey investigated how many pounds heavier respondents were than their perceived ideal weight. Consider the following data for the two-factor experiment as shown to the right. Complete parts a through c. Gender Men West 15 13 19 13 Region Midwest South Northeast 20 19 18 16 20 15 24 19 17 20 13 18 Women a. Determine if there is interaction between Region and Gender. Use the p-value approach and a significance level of 0.05 Find the hypotheses. Choose...
A survey investigated how many pounds heavier respondents were than their perceived ideal weight. Consider the...
 A survey investigated how many pounds heavier respondents were than their perceived ideal weight. Consider the following data for the two-factor experiment as shown to the right. Complete parts a through a. Determine if there is interaction between Region and Gender. Use the p-value approach and a significance le Find the hypotheses. Choose the correct answer below. O A. Ho Region and Gender do not interact to affect the mean response HA Region and Gender do interact to affect the...
Consider the following data for a two-factor experiment as shown to the right. Complete parts a through c Factor A Level1 Le Level 3 34 31 34 25 Level 2 34 27 21 Level 1 45 Factor B 31 27 25 19 b. Ba...
 Consider the following data for a two-factor experiment as shown to the right. Complete parts a through c Factor A Level1 Le Level 3 34 31 34 25 Level 2 34 27 21 Level 1 45 Factor B 31 27 25 19 b. Based on the sample data, can you conclude that the levels of factor A have equal means? Test using a significance eve o o.05 Choose the correct hypotheses below. HA: At least two levels of factor A...
plz answer from a to g A randomized block design yielded the ANOVA table to the...
 plz answer from a to g
A randomized block design yielded the ANOVA table to the right. Complete parts a through g Source Treatments Blocks Error Total df SS MS F 5 656 131.2 18.743 3 312 1040 14 857 15 105 70 23 1,073 a. How many blocks and treatments were used in the experiment? There were 6 blocks and 5 treatments used. b. How many observations were collected in the experiment? c. Specify the null and alternative hypotheses...
plz answer from a to g
A randomized block design yielded the ANOVA table to the right. Complete parts a through g Source Treatments Blocks Error Total df SS MS F 5 656 131.2 18.743 3 312 1040 14 857 15 105 70 23 1,073 a. How many blocks and treatments were used in the experiment? There were 6 blocks and 5 treatments used. b. How many observations were collected in the experiment? c. Specify the null and alternative hypotheses...
4. Use the ANOVA summary table to complete parts (a) through (c) below. Source Degrees of...
 4. Use the ANOVA summary table to complete parts (a) through (c) below. Source Degrees of Freedom Mean Square (Variance) 60 Sum of Squares 300 200 6,000 2,160 8,660 NWT AB 25 240 108 20 Error Total 143 a. At the 0.05 level of significance, is there an effect due to factor A? Determine the hypotheses. Choose the correct answer below. O A. Ho: There is no effect due to factor A. Hy: There is a positive effect due to...
In a one-way ANOVA, what does it mean to reject the statement in the null hypothesis...
In a one-way ANOVA, what does it mean to reject the statement in the null hypothesis if three treatment groups are being compared? Choose the correct answer below. A. Rejecting the statement in the null hypothesis means that there is insufficient evidence to conclude that the mean of one of the populations is different than the other two or that all three populations are different. B. Rejecting the statement in the null hypothesis means that there is sufficient evidence to...
(1 point) (Give answers to at least two decimal places. For simplicity, use the standard normal...
 (1 point) (Give answers to at least two decimal places. For simplicity, use the standard normal distribution bacause the samples are both large.) In order to compare the means of two populations, independent random samples of 4 observations are selected from each population, with the following results: Sample 1 Sample 2 81 -15582-125 Use a 97 % confidence interval to estimate the difference between the population means (M1-12). -304.502 (b) Test the null hypothesis: H0 the test statistic z The...
9.2.12-T Independent random samples selected from two normal populations produced the sample moans and standard deviations...
 9.2.12-T Independent random samples selected from two normal populations produced the sample moans and standard deviations shown to the right. a. Assuming equal variances, conduct the test Ho: (4-1) = 0 against H: (1 ) using a = 0.05. b. Find and interpret the 95% confidence interval for (1-2) Sample 1 Sample 2 ng = 1802-11 Xy = 5.1 X2 = 7.9 -3.2 Sy = 4.9 a. Find the test statistic The test statistics - 1.87. (Round to two decimal...
 Use the accompanying partially completed two-way ANOVA summary table to complete parts a through e below. Click the icon to view the table a) Complete the two-way ANOVA table below. Sum of Degrees of Mean Sum of Source Squares Freedom Squares Factor A 140 Factor B Interaction 20 Error 360 Total 600 44 (Type integers or decimals.) b) How many replications are present for each cell? c) Using c = 0.01, is there significant interaction between Factors A and B?...
 A company produces a single product on three production lines
that use different equipment. The production manager is considering
changing the layouts of the lines and would like to know what
effects different layouts would have on production output. Suppose
that the manager measured the average output for each line over
three randomly selected weeks using each of the three layouts under
consideration. The output (in hundreds of units produced) was
measured for each line for each of the four...
A company produces a single product on three production lines
that use different equipment. The production manager is considering
changing the layouts of the lines and would like to know what
effects different layouts would have on production output. Suppose
that the manager measured the average output for each line over
three randomly selected weeks using each of the three layouts under
consideration. The output (in hundreds of units produced) was
measured for each line for each of the four...
 A survey investigated how many pounds heavier respondents were than their perceived ideal weight. Consider the following data for the two-factor experiment as shown to the right. Complete parts a through c. Gender Men West 15 13 19 13 Region Midwest South Northeast 20 19 18 16 20 15 24 19 17 20 13 18 Women a. Determine if there is interaction between Region and Gender. Use the p-value approach and a significance level of 0.05 Find the hypotheses. Choose...
 A survey investigated how many pounds heavier respondents were than their perceived ideal weight. Consider the following data for the two-factor experiment as shown to the right. Complete parts a through a. Determine if there is interaction between Region and Gender. Use the p-value approach and a significance le Find the hypotheses. Choose the correct answer below. O A. Ho Region and Gender do not interact to affect the mean response HA Region and Gender do interact to affect the...
 Consider the following data for a two-factor experiment as shown to the right. Complete parts a through c Factor A Level1 Le Level 3 34 31 34 25 Level 2 34 27 21 Level 1 45 Factor B 31 27 25 19 b. Based on the sample data, can you conclude that the levels of factor A have equal means? Test using a significance eve o o.05 Choose the correct hypotheses below. HA: At least two levels of factor A...
 plz answer from a to g
A randomized block design yielded the ANOVA table to the right. Complete parts a through g Source Treatments Blocks Error Total df SS MS F 5 656 131.2 18.743 3 312 1040 14 857 15 105 70 23 1,073 a. How many blocks and treatments were used in the experiment? There were 6 blocks and 5 treatments used. b. How many observations were collected in the experiment? c. Specify the null and alternative hypotheses...
plz answer from a to g
A randomized block design yielded the ANOVA table to the right. Complete parts a through g Source Treatments Blocks Error Total df SS MS F 5 656 131.2 18.743 3 312 1040 14 857 15 105 70 23 1,073 a. How many blocks and treatments were used in the experiment? There were 6 blocks and 5 treatments used. b. How many observations were collected in the experiment? c. Specify the null and alternative hypotheses...
 4. Use the ANOVA summary table to complete parts (a) through (c) below. Source Degrees of Freedom Mean Square (Variance) 60 Sum of Squares 300 200 6,000 2,160 8,660 NWT AB 25 240 108 20 Error Total 143 a. At the 0.05 level of significance, is there an effect due to factor A? Determine the hypotheses. Choose the correct answer below. O A. Ho: There is no effect due to factor A. Hy: There is a positive effect due to...
 (1 point) (Give answers to at least two decimal places. For simplicity, use the standard normal distribution bacause the samples are both large.) In order to compare the means of two populations, independent random samples of 4 observations are selected from each population, with the following results: Sample 1 Sample 2 81 -15582-125 Use a 97 % confidence interval to estimate the difference between the population means (M1-12). -304.502 (b) Test the null hypothesis: H0 the test statistic z The...
 9.2.12-T Independent random samples selected from two normal populations produced the sample moans and standard deviations shown to the right. a. Assuming equal variances, conduct the test Ho: (4-1) = 0 against H: (1 ) using a = 0.05. b. Find and interpret the 95% confidence interval for (1-2) Sample 1 Sample 2 ng = 1802-11 Xy = 5.1 X2 = 7.9 -3.2 Sy = 4.9 a. Find the test statistic The test statistics - 1.87. (Round to two decimal...
Most questions answered within 3 hours.
-
You are a statistician and wish to estimate, with 90%
confidence, the proportion of adults who...
asked 1 hour ago -
A man is standing 3.40 m in front of a convex spherical mirror
of radius of...
asked 1 hour ago -
Match the annual percentage rate to each of these trade credit
terms:
__ 1/5, NET 60...
asked 1 hour ago -
ORGANIC CHEMISTRY QUESTION 5
PART A--------
Describe a chemical test for the identification of a double...
asked 5 hours ago -
Both Terence and Tong work at a local actuarial consulting firm
in Des Moines.
Terence arrives...
asked 5 hours ago -
QUESTION 11
. THE RESTING POTENTIAL IS CAUSED BY
.
. A.
. the rotation of...
asked 5 hours ago -
Need them in c++
1. Give the code for the
definition of a node for
the linked implementation of
a tree that contains...
asked 5 hours ago -
For sputtering-cleaning and sputter-depositing a metal,
would you use an AC or DC plasma? Explain your...
asked 5 hours ago -
Defend ONE of the following statements:
Prices should reflect the value consumers are willing to
pay....
asked 5 hours ago -
A magnet of mass 0.10 kg is dropped from rest and falls
vertically through a 20.0...
asked 5 hours ago -
A friend approaches you about a nutritional product and ask you
if it is worth it....
asked 5 hours ago -
What is bacterial transformation? What are the differences and
similarities between transforming a bacterial cell with...
asked 6 hours ago