Please help me with these questions!. Will give thumbs up thank you!
Please help me with these questions!. Will give thumbs up thank you!
Homework Answers
IF YOU HAVE ANY DOUBTS COMMENT BELOW I WILL BE TTHERE TO HELP YOU
ANSWER:
EXPLANATION:
1)
Here the graph is
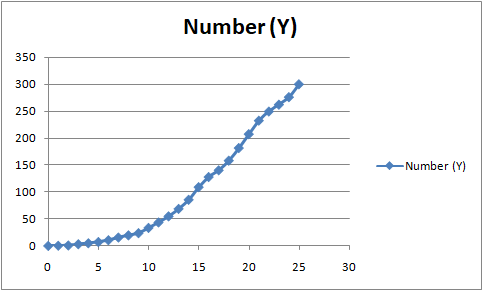
Here the cubic equation is
y ^ = -0.013x3 + 1.085x2 - 6.549x + 8.809
(b) Here the y^ (20000) = -0.013 * 153 + 1.085* 152 - 6.549 * 15 + 8.809 = 110.824
HEre the actual value = 109.5
so here the predicted value underestimated the actual value and it underestimate it by (110.824 - 109.5 = 1.824 )
(c) Here the actual population was = 300 million but there are more subscribers than the the population that means that on average there are more than 1 cell phone connection per capita in US. That could be possible due to multiple connections opted by the US general population.
HOPE IT HELPS YOU
RATE THUMBSUP IT HELPS ME ALOT
THANKS
Add Answer to:
Please help me with these questions!. Will give thumbs up thank you!
Please help with these questions, thank you! Will give thumbs up and great rating!
 Please help with these questions, thank you! Will give thumbs up
and great rating!
Please help with these questions, thank you! Will give thumbs up
and great rating!
Please help me with this question and I will thumbs up. Thank you. Find a +...
 Please help me with this question and I will thumbs up. Thank you.
Find a + b, a-b, and a × b for the positive binary values a = 0b 10.1 and b = 0b101. Express the results using binary representation. (12 points)
Please help me with this question and I will thumbs up. Thank you.
Find a + b, a-b, and a × b for the positive binary values a = 0b 10.1 and b = 0b101. Express the results using binary representation. (12 points)
Please help me with these following questions will give thumbs up. 5. What are the nursing...
Please help me with these following questions will give thumbs up. 5. What are the nursing considerations for a patient on magnesium sulfate, consider side effects and nursing assessment? How does this medication impact labor? 6. What are the environmental and medication safety considerations for a patient with pre-eclampsia with HELLP syndrome (Seizure, Fall Risk, Magnesium Sulfate, Calcium Gluconate, Domestic Violence)?
please help! please answer short and clear. thank you. will give a thumbs up! The following...
 please help! please answer short and clear. thank you. will
give a thumbs up!
The following reaction will not proceed as written. Clearly explain why this reaction will not occur. 1. LDA ix 2. Br The following reaction will not proceed as written. Clearly explain why this reaction will not occur. CHCI AICI:
please help! please answer short and clear. thank you. will
give a thumbs up!
The following reaction will not proceed as written. Clearly explain why this reaction will not occur. 1. LDA ix 2. Br The following reaction will not proceed as written. Clearly explain why this reaction will not occur. CHCI AICI:
Please help me with these following questions..... Will give thumbs up 3. Explain the signs/symptoms of...
Please help me with these following questions..... Will give thumbs up 3. Explain the signs/symptoms of hypovolemic shock that may occur after a sizeable blood loss from delivery of a preeclamptic patient. What medication being administered could have put the patient at risk for a higher blood loss and why? 4. What nursing assessment findings could the nurse observe while caring for a patient (maternal and fetal) with a diagnosis of pre-eclampsia with HELLP syndrome? What would be the signs...
Please help with these questions. Will give thumbs up top rating! thank you (1 point) The...
 Please help with these questions. Will give thumbs up top
rating! thank you
(1 point) The times for the mile run of a large group of male college students are approximately Normal with mean 7.02 minutes and standard deviation 0.72 minutes. Use the 68-95-99.7 rule to answer the following questions. (Start by making a sketch of the density curve you can use to mark areas on.) (a) what range of times covers the middle 99.7% of this distribution? (b) What...
Please help with these questions. Will give thumbs up top
rating! thank you
(1 point) The times for the mile run of a large group of male college students are approximately Normal with mean 7.02 minutes and standard deviation 0.72 minutes. Use the 68-95-99.7 rule to answer the following questions. (Start by making a sketch of the density curve you can use to mark areas on.) (a) what range of times covers the middle 99.7% of this distribution? (b) What...
Please help! will give a thumbs up rating. thank you! Which of the following bonds in...
 Please help! will give a thumbs up rating. thank you!
Which of the following bonds in the tertiary amine shown, CANNOT be formed via reductive amination? Select all that apply. (A) (B) Ос B ОА For each of the following pairs of molecules, indicate the compound containing the most basic nitrogen atom. C 요 NH VS N vs HN HAN A B D Pair 1: (Select] Pair 2: [Select] For each of the following pairs of molecules, indicate the compound...
Please help! will give a thumbs up rating. thank you!
Which of the following bonds in the tertiary amine shown, CANNOT be formed via reductive amination? Select all that apply. (A) (B) Ос B ОА For each of the following pairs of molecules, indicate the compound containing the most basic nitrogen atom. C 요 NH VS N vs HN HAN A B D Pair 1: (Select] Pair 2: [Select] For each of the following pairs of molecules, indicate the compound...
help me answer all questions and i will give a thumbs up 39 Which of theve...
 help me answer all questions and i will give a thumbs up
39 Which of theve 40. What is the major product of the following reastio b) e) OH What is the major product of the following reaction? 41. I. (CHshCuL CH CH 2.1,0 d) C6H,CCH=CH-CH3 a) CoHsC -CHCH3 b) C6H,C-CH=CH2 CH, OCH2 c) C&H,CH-CH CH2
help me answer all questions and i will give a thumbs up
39 Which of theve 40. What is the major product of the following reastio b) e) OH What is the major product of the following reaction? 41. I. (CHshCuL CH CH 2.1,0 d) C6H,CCH=CH-CH3 a) CoHsC -CHCH3 b) C6H,C-CH=CH2 CH, OCH2 c) C&H,CH-CH CH2
Please help with these questions. Will give thumbs up rating! Thank you! (1 point) Automated manufacturing...
 Please help with these questions. Will give thumbs up rating!
Thank you!
(1 point) Automated manufacturing operations are quite precise but still vary, often with distribution that are close to Normal. The width in inches of slots cut by a milling machine follows approximately the N(0.73, 0.0011) distribution. The specifications allow slot widths between 0.7298 and 0.7302. What proportion of slots meet these specifications? Answer as a percent: (1 point) A pharmaceutical manufacturer forms tablets by compressing a granular material...
Please help with these questions. Will give thumbs up rating!
Thank you!
(1 point) Automated manufacturing operations are quite precise but still vary, often with distribution that are close to Normal. The width in inches of slots cut by a milling machine follows approximately the N(0.73, 0.0011) distribution. The specifications allow slot widths between 0.7298 and 0.7302. What proportion of slots meet these specifications? Answer as a percent: (1 point) A pharmaceutical manufacturer forms tablets by compressing a granular material...
please answer completely and clearly. will give a thumbs up. thank you! SHORT ANSWER #29: How...
 please answer completely and clearly. will give a thumbs up.
thank you!
SHORT ANSWER #29: How would you carry out the synthesis below? Show the reagents needed for each step of your transformation, but do NOT draw the mechanisms for each step. (10 points) NH2 N
please answer completely and clearly. will give a thumbs up.
thank you!
SHORT ANSWER #29: How would you carry out the synthesis below? Show the reagents needed for each step of your transformation, but do NOT draw the mechanisms for each step. (10 points) NH2 N
 Please help with these questions, thank you! Will give thumbs up
and great rating!
Please help with these questions, thank you! Will give thumbs up
and great rating!
 Please help me with this question and I will thumbs up. Thank you.
Find a + b, a-b, and a × b for the positive binary values a = 0b 10.1 and b = 0b101. Express the results using binary representation. (12 points)
Please help me with this question and I will thumbs up. Thank you.
Find a + b, a-b, and a × b for the positive binary values a = 0b 10.1 and b = 0b101. Express the results using binary representation. (12 points)
 please help! please answer short and clear. thank you. will
give a thumbs up!
The following reaction will not proceed as written. Clearly explain why this reaction will not occur. 1. LDA ix 2. Br The following reaction will not proceed as written. Clearly explain why this reaction will not occur. CHCI AICI:
please help! please answer short and clear. thank you. will
give a thumbs up!
The following reaction will not proceed as written. Clearly explain why this reaction will not occur. 1. LDA ix 2. Br The following reaction will not proceed as written. Clearly explain why this reaction will not occur. CHCI AICI:
 Please help with these questions. Will give thumbs up top
rating! thank you
(1 point) The times for the mile run of a large group of male college students are approximately Normal with mean 7.02 minutes and standard deviation 0.72 minutes. Use the 68-95-99.7 rule to answer the following questions. (Start by making a sketch of the density curve you can use to mark areas on.) (a) what range of times covers the middle 99.7% of this distribution? (b) What...
Please help with these questions. Will give thumbs up top
rating! thank you
(1 point) The times for the mile run of a large group of male college students are approximately Normal with mean 7.02 minutes and standard deviation 0.72 minutes. Use the 68-95-99.7 rule to answer the following questions. (Start by making a sketch of the density curve you can use to mark areas on.) (a) what range of times covers the middle 99.7% of this distribution? (b) What...
 Please help! will give a thumbs up rating. thank you!
Which of the following bonds in the tertiary amine shown, CANNOT be formed via reductive amination? Select all that apply. (A) (B) Ос B ОА For each of the following pairs of molecules, indicate the compound containing the most basic nitrogen atom. C 요 NH VS N vs HN HAN A B D Pair 1: (Select] Pair 2: [Select] For each of the following pairs of molecules, indicate the compound...
Please help! will give a thumbs up rating. thank you!
Which of the following bonds in the tertiary amine shown, CANNOT be formed via reductive amination? Select all that apply. (A) (B) Ос B ОА For each of the following pairs of molecules, indicate the compound containing the most basic nitrogen atom. C 요 NH VS N vs HN HAN A B D Pair 1: (Select] Pair 2: [Select] For each of the following pairs of molecules, indicate the compound...
 help me answer all questions and i will give a thumbs up
39 Which of theve 40. What is the major product of the following reastio b) e) OH What is the major product of the following reaction? 41. I. (CHshCuL CH CH 2.1,0 d) C6H,CCH=CH-CH3 a) CoHsC -CHCH3 b) C6H,C-CH=CH2 CH, OCH2 c) C&H,CH-CH CH2
help me answer all questions and i will give a thumbs up
39 Which of theve 40. What is the major product of the following reastio b) e) OH What is the major product of the following reaction? 41. I. (CHshCuL CH CH 2.1,0 d) C6H,CCH=CH-CH3 a) CoHsC -CHCH3 b) C6H,C-CH=CH2 CH, OCH2 c) C&H,CH-CH CH2
 Please help with these questions. Will give thumbs up rating!
Thank you!
(1 point) Automated manufacturing operations are quite precise but still vary, often with distribution that are close to Normal. The width in inches of slots cut by a milling machine follows approximately the N(0.73, 0.0011) distribution. The specifications allow slot widths between 0.7298 and 0.7302. What proportion of slots meet these specifications? Answer as a percent: (1 point) A pharmaceutical manufacturer forms tablets by compressing a granular material...
Please help with these questions. Will give thumbs up rating!
Thank you!
(1 point) Automated manufacturing operations are quite precise but still vary, often with distribution that are close to Normal. The width in inches of slots cut by a milling machine follows approximately the N(0.73, 0.0011) distribution. The specifications allow slot widths between 0.7298 and 0.7302. What proportion of slots meet these specifications? Answer as a percent: (1 point) A pharmaceutical manufacturer forms tablets by compressing a granular material...
 please answer completely and clearly. will give a thumbs up.
thank you!
SHORT ANSWER #29: How would you carry out the synthesis below? Show the reagents needed for each step of your transformation, but do NOT draw the mechanisms for each step. (10 points) NH2 N
please answer completely and clearly. will give a thumbs up.
thank you!
SHORT ANSWER #29: How would you carry out the synthesis below? Show the reagents needed for each step of your transformation, but do NOT draw the mechanisms for each step. (10 points) NH2 N
Most questions answered within 3 hours.
-
A regression equation that describes the relationship between
the amount of the bill ($) at a...
asked 43 minutes ago -
exercise on VSEPR and molecular structrue.
octahedral
SeCl62-
TeCl62-
ClF62-
distorted
SeF62–
IF6–
asked 1 hour ago -
284 mL of a 0.52 M potassium hydroxide solution is added to 467
mL of a...
asked 1 hour ago -
Little’s Law: Val d’Costa is a world famous ski village in the
French Alps. Because of...
asked 2 hours ago -
Find the absolute error D for the calculation if A + B/C=D A=
9.4 +/- 0.4...
asked 2 hours ago -
New Air Heating and Cooling, manufactures furnaces and central
air units. The company pride itself on...
asked 2 hours ago -
A coach uses a new technique to train gymnasts. Seven
gymnasts were randomly selected and their...
asked 4 hours ago -
While rotating the tires on your car you notice a rock [mass =
0.1 Kg] stuck...
asked 6 hours ago -
Using MARS simulator, write MIPS programs according to
the following scenarios: Receive a positive integer number...
asked 8 hours ago -
An object in front of a concave mirror has a real image that is
11.5 cm...
asked 8 hours ago -
Consider the reaction, C3 H8 + O2 --> CO2 + H2O. How many
moles of O2...
asked 10 hours ago -
You and your opponent both roll a fair die. If you both roll the
same number,...
asked 10 hours ago