You manage the inventory for a car dealership. Data on current inventory can be found in the week 2 data set excel file. Management would like you to assess current inventory on the dealership lot....
You manage the inventory for a car dealership. Data on current inventory can be found in the week 2 data set excel file.
Management would like you to assess current inventory on the dealership lot.
Using the Week 2 Data Set, create and calculate the following in Microsoft® Excel®:
- Show a a pie chart which summarizes the colors of the cars in the sample.
2. Show a bar chart which summarizes the number of each of the models of cars in the sample.
3. Show a frequency table for classes of MPG, including frequency and relative frequency for the cars in the sample.
4. Calculate the mean Days in Inventory for the cars in the sample. Also, do the following:
- Compare the mean to the median and the mode.
- Highlight the value that would be a better representation of the "typical" price of a car in inventory.
5. Calculate the standard deviation of the Days in Inventory for the cars in the sample.
6. Calculate the 5 number summary for the suggested retail prices of the cars in the sample. This consists of the 1st, 2nd, 3rd, 4th quartile, and the IQR.
Sample Car # Color MPG Suggest Retail Price Option Package Days in Inventory
1 Grey 27.6 $ 24,390.00 LX 1
2 Grey 32.4 $ 21,780.00 Touring 10
3 Blue 33.2 $ 21,149.00 Touring 28
4 Black 34.7 $ 22,069.00 LX 21
5 Blue 27.2 $ 22,532.00 Touring 16
6 Blue 26.6 $ 20,345.00 Touring 22
7 Red 37.3 $ 22,112.00 EX 12
8 Silver 34.9 $ 21,289.00 Touring 23
9 Silver 29.6 $ 24,871.00 LX 15
10 Silver 32.3 $ 25,389.00 EX 8
11 Grey 31.9 $ 25,998.00 EX 28
12 Red 26.4 $ 19,713.00 LX 55
13 Black 34.8 $ 25,213.00 EX 2
14 Silver 35.9 $ 24,467.00 Touring 33
15 Black 34.6 $ 21,402.00 LX 17
16 Black 33.3 $ 20,351.00 LX 14
17 Grey 33.1 $ 23,732.00 Touring 1
18 Red 37.5 $ 24,558.00 Touring 2
19 Red 27.8 $ 19,167.00 LX 18
20 Red 36.1 $ 19,903.00 Touring 22
21 Blue 28.8 $ 22,140.00 Touring 19
22 Red 26.2 $ 22,180.00 EX 41
23 Silver 27.4 $ 23,120.00 Touring 33
24 Black 34.9 $ 19,837.00 Touring 21
25 Red 36.5 $ 24,666.00 EX 31
26 Red 26.3 $ 19,446.00 EX 35
27 Blue 31.4 $ 23,954.00 Touring 11
28 Blue 30.9 $ 21,201.00 LX 3
29 Red 27.4 $ 21,346.00 EX 26
30 Red 36 $ 19,406.00 EX 31
Homework Answers

Frequency table for car model.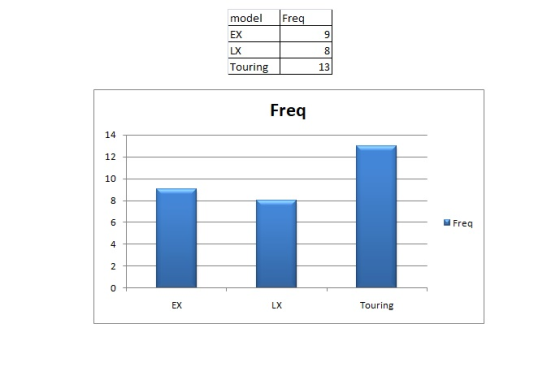
Frequency table for MPG

Standard deviation of days in inventory for car is 12.86
Median is 20
Mode is 1

Add Answer to:
You manage the inventory for a car dealership. Data on current inventory can be found in the week 2 data set excel file. Management would like you to assess current inventory on the dealership lot....
Calculate the standard deviation of the Days in Inventory for the cars in the sample. Answer...
 Calculate the standard deviation of the Days in Inventory for
the cars in the sample.
Answer format: ##.##
? =STDEV.S(DATA!F2:F31)
Sample Car # Suggest Retail Option Price Days in Inventory Package Color Grey Grev Blue Black Blue Blue Red MPG 27.6 $ 24,390.00 LX 32.4 $ 21,780.00 Touring 33.2 21,149.00 Touring 34.7 22,069.00 LX 27.2$ 22,532.00 Touring 26.6 $ 20,345.00 Touring 37.3$ 22,112.00 EX 34.9 $ 21,289.00 Touring 29.6$ 24,871.00 LX 32.3 25,389.00 EX 31.9$ 25,998.00 EX 26.4$ 19,713.00 LX...
Calculate the standard deviation of the Days in Inventory for
the cars in the sample.
Answer format: ##.##
? =STDEV.S(DATA!F2:F31)
Sample Car # Suggest Retail Option Price Days in Inventory Package Color Grey Grev Blue Black Blue Blue Red MPG 27.6 $ 24,390.00 LX 32.4 $ 21,780.00 Touring 33.2 21,149.00 Touring 34.7 22,069.00 LX 27.2$ 22,532.00 Touring 26.6 $ 20,345.00 Touring 37.3$ 22,112.00 EX 34.9 $ 21,289.00 Touring 29.6$ 24,871.00 LX 32.3 25,389.00 EX 31.9$ 25,998.00 EX 26.4$ 19,713.00 LX...
Question 11 B0/2 pts 3 Detalls Consider the following data set that contains information about a...
 Question 11 B0/2 pts 3 Detalls Consider the following data set that contains information about a sample of ten 2015 Honda Accord offered for sale Vehicle Condition Color 100miles 1000) Mileage Price 1 average green 19 2 good blue 29 3 good silver 33 28 4 poor red 39 27 5 green 26 6 good silver 25 7 excellent green 24 8 poor black 46 23 9 good white 22 10 good blue 21 The scatter plot that summarizes the...
How would I make the Excel speadsheet do these things in seperate colums? A B 2...
 How would I make the Excel speadsheet do
these things in seperate colums?
A B 2 1 ld 21 3 M IN L Doors Lowercase Sentence 3 3 4. 3 بیب 32 بیب 7 8 بیب بیب 9 10 بیب بیب 12 بیب 13 بیب C D E F Price Age_08_04 Mfg_Year KM 13500 23 200246986 13750 23 2002 72937 13950 24 2002 41711 14950 26 2002 48000 13750 30 2002 38500 12950 2002 61000 16900 27 2002 94612 18600...
How would I make the Excel speadsheet do
these things in seperate colums?
A B 2 1 ld 21 3 M IN L Doors Lowercase Sentence 3 3 4. 3 بیب 32 بیب 7 8 بیب بیب 9 10 بیب بیب 12 بیب 13 بیب C D E F Price Age_08_04 Mfg_Year KM 13500 23 200246986 13750 23 2002 72937 13950 24 2002 41711 14950 26 2002 48000 13750 30 2002 38500 12950 2002 61000 16900 27 2002 94612 18600...
 Calculate the standard deviation of the Days in Inventory for
the cars in the sample.
Answer format: ##.##
? =STDEV.S(DATA!F2:F31)
Sample Car # Suggest Retail Option Price Days in Inventory Package Color Grey Grev Blue Black Blue Blue Red MPG 27.6 $ 24,390.00 LX 32.4 $ 21,780.00 Touring 33.2 21,149.00 Touring 34.7 22,069.00 LX 27.2$ 22,532.00 Touring 26.6 $ 20,345.00 Touring 37.3$ 22,112.00 EX 34.9 $ 21,289.00 Touring 29.6$ 24,871.00 LX 32.3 25,389.00 EX 31.9$ 25,998.00 EX 26.4$ 19,713.00 LX...
Calculate the standard deviation of the Days in Inventory for
the cars in the sample.
Answer format: ##.##
? =STDEV.S(DATA!F2:F31)
Sample Car # Suggest Retail Option Price Days in Inventory Package Color Grey Grev Blue Black Blue Blue Red MPG 27.6 $ 24,390.00 LX 32.4 $ 21,780.00 Touring 33.2 21,149.00 Touring 34.7 22,069.00 LX 27.2$ 22,532.00 Touring 26.6 $ 20,345.00 Touring 37.3$ 22,112.00 EX 34.9 $ 21,289.00 Touring 29.6$ 24,871.00 LX 32.3 25,389.00 EX 31.9$ 25,998.00 EX 26.4$ 19,713.00 LX...
 Question 11 B0/2 pts 3 Detalls Consider the following data set that contains information about a sample of ten 2015 Honda Accord offered for sale Vehicle Condition Color 100miles 1000) Mileage Price 1 average green 19 2 good blue 29 3 good silver 33 28 4 poor red 39 27 5 green 26 6 good silver 25 7 excellent green 24 8 poor black 46 23 9 good white 22 10 good blue 21 The scatter plot that summarizes the...
 How would I make the Excel speadsheet do
these things in seperate colums?
A B 2 1 ld 21 3 M IN L Doors Lowercase Sentence 3 3 4. 3 بیب 32 بیب 7 8 بیب بیب 9 10 بیب بیب 12 بیب 13 بیب C D E F Price Age_08_04 Mfg_Year KM 13500 23 200246986 13750 23 2002 72937 13950 24 2002 41711 14950 26 2002 48000 13750 30 2002 38500 12950 2002 61000 16900 27 2002 94612 18600...
How would I make the Excel speadsheet do
these things in seperate colums?
A B 2 1 ld 21 3 M IN L Doors Lowercase Sentence 3 3 4. 3 بیب 32 بیب 7 8 بیب بیب 9 10 بیب بیب 12 بیب 13 بیب C D E F Price Age_08_04 Mfg_Year KM 13500 23 200246986 13750 23 2002 72937 13950 24 2002 41711 14950 26 2002 48000 13750 30 2002 38500 12950 2002 61000 16900 27 2002 94612 18600...
Most questions answered within 3 hours.
-
Sociology Question Emile Durkheim
What role does mass media play in the lives of contemporary
citizens?...
asked 2 minutes from now -
Why would you silence gene expression for both wild-type and
mutants? I am on a question...
asked 6 minutes ago -
While all of the elements below are helpful, Booth et al. (2008)
emphasize that it is...
asked 10 minutes ago -
2. Use the three-step method to analyze the effects of the event
on the equilibrium price...
asked 11 minutes ago -
Draw a Venn diagram of three domains of life and explain.
asked 15 minutes ago -
In testing a new drug, researchers found that 5% of all patients
using it will have...
asked 43 minutes ago -
List the six general types of information management systems,
and give one logistics application to each...
asked 34 minutes ago -
XYZ corporation uses statistical quality control to monitor the
quality of their product. They have determined...
asked 38 minutes ago -
If a liquid
contains 60% sugar and 40% water through out its composition then
what is...
asked 46 minutes ago -
The data in set A represents prices (with tax included) of a
large cup of regular...
asked 55 minutes ago -
How do neuropsychological assessments provide information about
impairment? How could this information be misused?
asked 48 minutes ago -
Define SNP and elaborate various type of SNPs and their
importance in pharmacogenetics?
asked 52 minutes ago