
Homework Answers


Add Answer to:
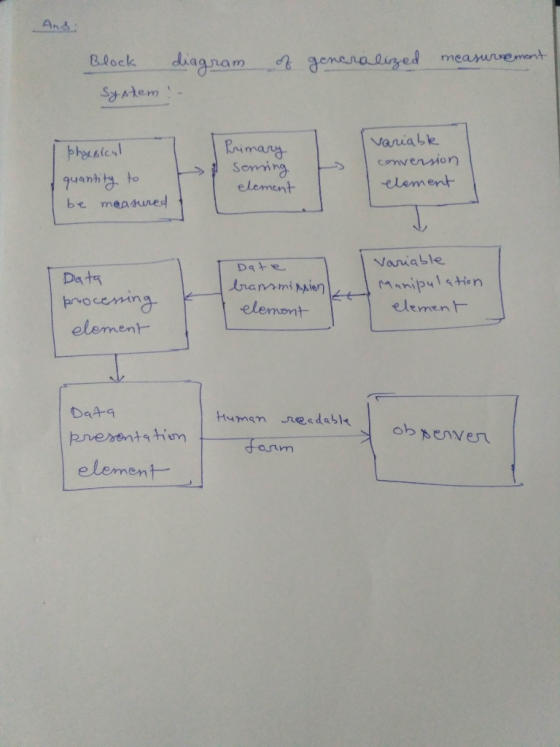
Q4) a) Draw the block diagram of a general measurement System. Explain each block by giving examples. b) Write down...
4 (a) Based on the block diagram for a control system (Figure Q4(a) below) determine the...
 4 (a) Based on the block diagram for a control system (Figure Q4(a) below) determine the transfer function between the error and the set point, E(s)/R(s) (8 marks) R(s)+ c(p) m(s) Figure Q4(a) Figure Q4(b) below shows two different control strategies for a continuous stirred tank reactor (CSTR). The reaction A → B is exothermic and the heat generated is removed by the coolant flowing through the jacket. It is assumed the flowrate of the reactor feed is fixed. Two...
The state variable model of the two tanks process is given by the equations r1 10 01 r1o 2 0-1 lu Tank 1 Tank 2 Explain the differential equations for the tanks Draw the block diagram for the system...
 The state variable model of the two tanks process is given by the equations r1 10 01 r1o 2 0-1 lu Tank 1 Tank 2 Explain the differential equations for the tanks Draw the block diagram for the system model * .Modify the block diagram to realize the system model by first order transfer functions: 1+Ts Determine the controllability and observability of the system model Design a full-state feedback with the eigen values λ-λ2--2 of the closed loop system Design...
Consider a two-tank system, where x, is the level of the first tank, and x2 is the level of the second tank. This dynamic system is described by the -xj-x2. The output to be Q4. following model: dt c...
 Consider a two-tank system, where x, is the level of the first tank, and x2 is the level of the second tank. This dynamic system is described by the -xj-x2. The output to be Q4. following model: dt controlled is the level of the second tank. (a)Write down the state-space model in matrix form. Verify the 20% (b)Design a state feedback controller so that the closed-loop poles are 25% controllability of the system located at -3 and -4 (c) The...
3. Block diagram consist of functions performed by each component of a system and flow of signals meanwhile, signal...
 3. Block diagram consist of functions performed by each component of a system and flow of signals meanwhile, signal flow graph consists of branches which represents the systems and nodes which represents the signals For the block diagram shown in Figure 5, determine the relationship between the output variable C(s) and the input variable R(s) by analyzing the system's variables. (a) (12 marks) Gil GloC V(s) Figure 5 (b) Consider a simple first-order system G(s). Find the time constant and...
Q4. (a) Reduce the block diagram shown in Figure Q4a to a single mathematical expression suitable for implementation in MATLAB. Each letter represents a transfer function in the s-domain. (...
 Q4. (a) Reduce the block diagram shown in Figure Q4a to a single mathematical expression suitable for implementation in MATLAB. Each letter represents a transfer function in the s-domain. (10) G1 G2 G3 G4 G5 G6 Figure Q4a (b) Describe the process of generating the Nyquist plot. (c) Discuss how you would investigate the stability of a control system using the Nyquist plot and gain and phase margins of stability. (7) Q4 Total Marks [25] educe the block diagram shown...
(20 points) Give a detail design of pressure measurement system by using strain gage as a sensor. The output signal is voltage 1) Draw circuit diagram/and sensing element with strain gauge. 2) Dr...
 (20 points) Give a detail design of pressure measurement system by using strain gage as a sensor. The output signal is voltage 1) Draw circuit diagram/and sensing element with strain gauge. 2) Draw a block diagram and name a part on each block. 3) Give the sensitivity of each block 4) Give an equation to show the relationship of input pressure and output 2. voltage
(20 points) Give a detail design of pressure measurement system by using strain gage as...
(20 points) Give a detail design of pressure measurement system by using strain gage as a sensor. The output signal is voltage 1) Draw circuit diagram/and sensing element with strain gauge. 2) Draw a block diagram and name a part on each block. 3) Give the sensitivity of each block 4) Give an equation to show the relationship of input pressure and output 2. voltage
(20 points) Give a detail design of pressure measurement system by using strain gage as...
Consider an Ehrenfest chain with 6 particles. (a) Write down the transition matrix and draw the transition diagram. b)...
 Consider an Ehrenfest chain with 6 particles. (a) Write down the transition matrix and draw the transition diagram. b) If the chain starts with 3 particles in the left partition, write down the state distribution at the first time step. (c) Find the stationary distribution using the detailed balance condi tion
Consider an Ehrenfest chain with 6 particles. (a) Write down the transition matrix and draw the transition diagram. b) If the chain starts with 3 particles in the left...
Consider an Ehrenfest chain with 6 particles. (a) Write down the transition matrix and draw the transition diagram. b) If the chain starts with 3 particles in the left partition, write down the state distribution at the first time step. (c) Find the stationary distribution using the detailed balance condi tion
Consider an Ehrenfest chain with 6 particles. (a) Write down the transition matrix and draw the transition diagram. b) If the chain starts with 3 particles in the left...
Q4. (a) Reduce the block diagram shown in Figure Q4a to a single mathematical expression suitable...
 Q4. (a) Reduce the block diagram shown in Figure Q4a to a single mathematical expression suitable for implementation in MATLAB. Each letter represents a transfer function in the s-domain. 10) G1G2 G3 G4 G5 G6 Figure Q4a (b) Describe the process of generating the Nyquist plot. (c) Discuss how you would investigate the stability of a control system using the Nyquist plot and gain and phase margins of stability. 7)
a) Draw the block diagram of a generic closed-loop digital control system. Show clearly all blocks...
 a) Draw the block diagram of a generic closed-loop digital control system. Show clearly all blocks and all signals (continuous and discrete, including disturbances added to the forward path). b) Explain the advantages of digital control over analogue control. c) Explain why the Zero-Order-Hold (ZOH) operation may destabilize the system. (4) 14) Table of Laplace and z-transform Time function Laplace transform E() 2-Transform E(z) er) TED 20- lime-of-16- ri(n) 410) p=!11) ( 101) 10-10) re-10) त 21-26
Given the two dynamic systems S2 a ER Si has state r1, control u, and output y. S2 has state (x2,...
 Given the two dynamic systems S2 a ER Si has state r1, control u, and output y. S2 has state (x2, r3), control w and output z. (a) Draw a dynamic diagram of system S2 (b) Express the equations for S1 and S2 in matrix from and determine whether each system is controllable, observable. (c) These two systems are connected in series with w-y. The resulting system is called S3. Write down the matrix form of the equation for S3...
 4 (a) Based on the block diagram for a control system (Figure Q4(a) below) determine the transfer function between the error and the set point, E(s)/R(s) (8 marks) R(s)+ c(p) m(s) Figure Q4(a) Figure Q4(b) below shows two different control strategies for a continuous stirred tank reactor (CSTR). The reaction A → B is exothermic and the heat generated is removed by the coolant flowing through the jacket. It is assumed the flowrate of the reactor feed is fixed. Two...
 The state variable model of the two tanks process is given by the equations r1 10 01 r1o 2 0-1 lu Tank 1 Tank 2 Explain the differential equations for the tanks Draw the block diagram for the system model * .Modify the block diagram to realize the system model by first order transfer functions: 1+Ts Determine the controllability and observability of the system model Design a full-state feedback with the eigen values λ-λ2--2 of the closed loop system Design...
 Consider a two-tank system, where x, is the level of the first tank, and x2 is the level of the second tank. This dynamic system is described by the -xj-x2. The output to be Q4. following model: dt controlled is the level of the second tank. (a)Write down the state-space model in matrix form. Verify the 20% (b)Design a state feedback controller so that the closed-loop poles are 25% controllability of the system located at -3 and -4 (c) The...
 3. Block diagram consist of functions performed by each component of a system and flow of signals meanwhile, signal flow graph consists of branches which represents the systems and nodes which represents the signals For the block diagram shown in Figure 5, determine the relationship between the output variable C(s) and the input variable R(s) by analyzing the system's variables. (a) (12 marks) Gil GloC V(s) Figure 5 (b) Consider a simple first-order system G(s). Find the time constant and...
 Q4. (a) Reduce the block diagram shown in Figure Q4a to a single mathematical expression suitable for implementation in MATLAB. Each letter represents a transfer function in the s-domain. (10) G1 G2 G3 G4 G5 G6 Figure Q4a (b) Describe the process of generating the Nyquist plot. (c) Discuss how you would investigate the stability of a control system using the Nyquist plot and gain and phase margins of stability. (7) Q4 Total Marks [25] educe the block diagram shown...
 (20 points) Give a detail design of pressure measurement system by using strain gage as a sensor. The output signal is voltage 1) Draw circuit diagram/and sensing element with strain gauge. 2) Draw a block diagram and name a part on each block. 3) Give the sensitivity of each block 4) Give an equation to show the relationship of input pressure and output 2. voltage
(20 points) Give a detail design of pressure measurement system by using strain gage as...
(20 points) Give a detail design of pressure measurement system by using strain gage as a sensor. The output signal is voltage 1) Draw circuit diagram/and sensing element with strain gauge. 2) Draw a block diagram and name a part on each block. 3) Give the sensitivity of each block 4) Give an equation to show the relationship of input pressure and output 2. voltage
(20 points) Give a detail design of pressure measurement system by using strain gage as...
 Consider an Ehrenfest chain with 6 particles. (a) Write down the transition matrix and draw the transition diagram. b) If the chain starts with 3 particles in the left partition, write down the state distribution at the first time step. (c) Find the stationary distribution using the detailed balance condi tion
Consider an Ehrenfest chain with 6 particles. (a) Write down the transition matrix and draw the transition diagram. b) If the chain starts with 3 particles in the left...
Consider an Ehrenfest chain with 6 particles. (a) Write down the transition matrix and draw the transition diagram. b) If the chain starts with 3 particles in the left partition, write down the state distribution at the first time step. (c) Find the stationary distribution using the detailed balance condi tion
Consider an Ehrenfest chain with 6 particles. (a) Write down the transition matrix and draw the transition diagram. b) If the chain starts with 3 particles in the left...
 Q4. (a) Reduce the block diagram shown in Figure Q4a to a single mathematical expression suitable for implementation in MATLAB. Each letter represents a transfer function in the s-domain. 10) G1G2 G3 G4 G5 G6 Figure Q4a (b) Describe the process of generating the Nyquist plot. (c) Discuss how you would investigate the stability of a control system using the Nyquist plot and gain and phase margins of stability. 7)
 a) Draw the block diagram of a generic closed-loop digital control system. Show clearly all blocks and all signals (continuous and discrete, including disturbances added to the forward path). b) Explain the advantages of digital control over analogue control. c) Explain why the Zero-Order-Hold (ZOH) operation may destabilize the system. (4) 14) Table of Laplace and z-transform Time function Laplace transform E() 2-Transform E(z) er) TED 20- lime-of-16- ri(n) 410) p=!11) ( 101) 10-10) re-10) त 21-26
 Given the two dynamic systems S2 a ER Si has state r1, control u, and output y. S2 has state (x2, r3), control w and output z. (a) Draw a dynamic diagram of system S2 (b) Express the equations for S1 and S2 in matrix from and determine whether each system is controllable, observable. (c) These two systems are connected in series with w-y. The resulting system is called S3. Write down the matrix form of the equation for S3...
Most questions answered within 3 hours.
-
Explain in detail
Germany is the fifth largest economy
explain what goods and services Germany specializes...
asked 59 seconds from now -
The density of platinum is 21.45 g/mL. If a cube of platinum
with a mass of...
asked 4 minutes ago -
Accounts Receivable
Sales
A/R Posting
Extended Sales Invoice
Packing Slip
Compare invoice to packing slip 2...
asked 7 minutes ago -
Michaella, age 23, is a full-time law student and is claimed by
her parents as a...
asked 7 minutes ago -
Why are polymers not typically casted into products?
asked 24 minutes ago -
When rolling a die 129 times, what is the probability of rolling
a 6 no more...
asked 41 minutes ago -
4. A call option currently sells for $7.75. It has a strike
price of $85 and...
asked 30 minutes ago -
1.
You need to prepare 10.0 liters of an acid aqueous solution with a
pH of...
asked 33 minutes ago -
Along an aggregate supply curve, if the level of output is less
than the natural level...
asked 33 minutes ago -
By 2025, annual consumption in emerging markets will total $30
trillion and contribute more than ________...
asked 38 minutes ago -
At what point does reformation cease to be a viable option for
those who are oppressed...
asked 42 minutes ago -
Place letters corresponding to amounts in the proper order for
lightest to heaviest samples:
a) 2100...
asked 47 minutes ago