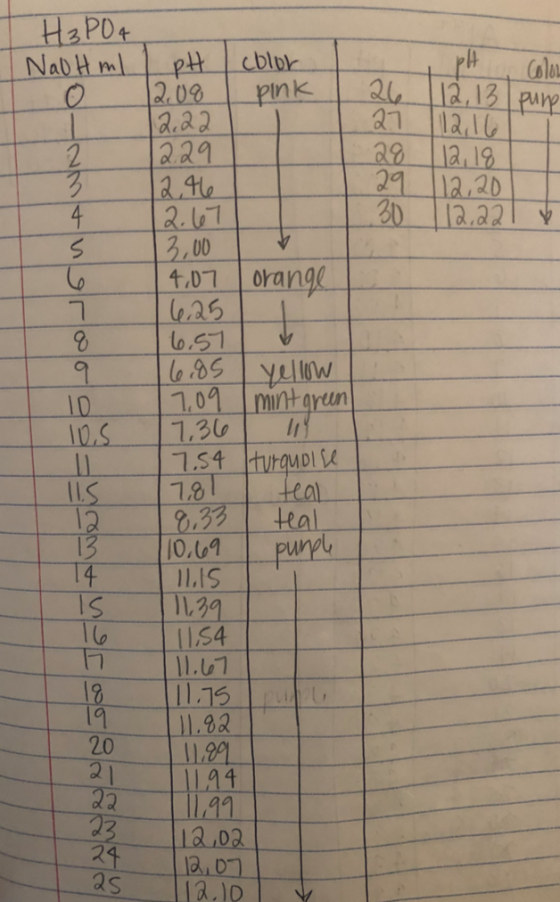
a. Plot your titration data (volume of NaOH used on the x-axis and the corresponding pH value on the y-axis)
-
Phosphoric Acid + Sodium Hydroxide
-
Al3+ + Sodium Hydroxide

data:

Homework Answers
 This is the graph of Phosphoric
acid vs NaOH
This is the graph of Phosphoric
acid vs NaOH  This is the Graph for Aluminium
vs NaOH
This is the Graph for Aluminium
vs NaOH
Add Answer to:
a. Plot your titration data (volume of NaOH used on the x-axis and the corresponding pH value on the y-axis) Phosphori...
Draw the titration curve for the titration of 20 mL of a 0.12 M solution of...
Draw the titration curve for the titration of 20 mL of a 0.12 M solution of glutamate (carboxylic acid pKa = 2.19, amino pKa = 9.67, you need to know the pKa for the R group) with 0.10 M sodium hydroxide. Clearly label the axes of your graph (pH vs mL of NaOH added.) Be sure to include pH values and volumes for the following: Start of the titration (no sodium hydroxide added), the pH at the volume that is...
Given the graph below, identify the volume of the endpoint of the phosphoric acid and sodium...
 Given the graph below, identify the volume of the endpoint of the
phosphoric acid and sodium hydroxide titration.
pH vs. Volume Volume de NaOH (m)
Given the graph below, identify the volume of the endpoint of the
phosphoric acid and sodium hydroxide titration.
pH vs. Volume Volume de NaOH (m)
Part II. 3 UNKNOWN Number: Mass of Acid: 161M NaoH Molarity of NaOH used: 4. Attach the graph of your titration cu...
 Part II. 3 UNKNOWN Number: Mass of Acid: 161M NaoH Molarity of NaOH used: 4. Attach the graph of your titration curve with pH vs Volume of NaOH, with proper format and labeling. 5. Calculate the molar mass of your unknown acid using the endpoint for the second step of the reaction between the acid and sodium hydroxide. Show calculations. Molar Mass 6. Write a "B" on your graph to precisely label two points where a buffer exists with similar...
Plot the titration curve for the following data. (Plot volume of base on the x-axis and...
 Plot the titration curve for the following data. (Plot volume of base on the x-axis and pH on the y- axis) Label the equivalence point on your graph. Volume of Base (ml) 1.00 2.00 3.00 4.00 5.00 6.00 7.00 8.00 9.00 10.00 10.50 11.00 11.50 12.00 13.00 14.00 15.00 16.00 16.50 17.00 17.50 18.00 18.50 18.70 18.90 19.10 19.30 20.50 21.00 21.50 pH 3.15 3.24 3.39 3.54 3.63 3.78 3.85 3.98 4.11 4.20 4.26 4.31 4.39 4.47 4.60 4.75 4.90...
3. What volume of 0.025 M NaOH will be required to reach the endpoint in a...
 3. What volume of 0.025 M NaOH will be required to reach the endpoint in a titration with 25.00 ml of 0.10 M HCI? Show your work with units and correct significant figures. Circle your answer. 4. Calculate the molarity of a sodium hydroxide solution if 25.00 mL 0.100 M maleic acid requires 22.10 ml of NaOH to reach the endpoint. Show your work with units and correct significant figures. Circle your answer. 5. The following data were collected in...
A 32.44 mL sample of 0.202 M acetic acid is titrated with 0.185 M sodium hydroxide. Calculate the pH of...
A 32.44 mL sample of 0.202 M acetic acid is titrated with 0.185 M sodium hydroxide. Calculate the pH of the solution for each the following. You will need to look up values for ionization constants. Using your answers for 1-5, sketch the titration curve. Be sure to label axes, midpoint, and equivalence point, and to identify each of the five data points on the curve. before any NaOH is added. at the midpoint after 24.00 mL of NaOH is added. at the equivalence...
a) Use this plot to estimate the volume of NaOH required to reach the equivalence point...
 a) Use this plot to estimate the volume of NaOH
required to reach the equivalence point of each titration
curve.
b) Estimate the original concentration of weak acid in
solution before strong base was added.
c) Find the midpoint pH for each of the trials using
half the volume of NaOH required to reach the equivalence point for
that trial. Check if this pH is at the most flat part of the
titration curve. This is the pKa of the...
a) Use this plot to estimate the volume of NaOH
required to reach the equivalence point of each titration
curve.
b) Estimate the original concentration of weak acid in
solution before strong base was added.
c) Find the midpoint pH for each of the trials using
half the volume of NaOH required to reach the equivalence point for
that trial. Check if this pH is at the most flat part of the
titration curve. This is the pKa of the...
Sketch a pH vs. Volume added graph (titration curve) for a diprotic acid being titrated with...
Sketch a pH vs. Volume added graph (titration curve) for a diprotic acid being titrated with NaOH. Label the axis and equivalence points.
PRE-LAB for pH titration of a Strong Acid with Base This is due before the lab...
 PRE-LAB for pH titration of a Strong Acid with Base This is due before the lab begins, Name 1. Calculate the pH of the following solutions: (a) 1 M NaCl Does not dissociate in water to produce either hydrogen or nyot thus it is a neutral Sall, so 7. (b) 1 M HOAc (Ka - 1.8 x 10⁻⁵) duce either hydrogen or hyd xde ion, (c) 1 M NHOH (Kb = 1.8 x 10⁻⁵) (d) 0.1 M NaOAC (e) 0.1...
Using the literature/accepted Ka value where needed, calculate the expected pH of the titration mixture: When...
 Using the literature/accepted Ka value where needed,
calculate the expected pH of the titration mixture:
When 45 mL of NaOH has been added
At the equivalence point
RAW DATA AND OBSERVATIONS Table 1: Titration of acetic acid with O, DRH58 , mol L1 NaOH(aq) (5.5 marks) Concentration of acid: O 080 yeiCo mol L- Colour change: dok pak to qelloo 25.00 methyl-red b.62 mL Volume of acid sample: Indicator: Sharp or gradual change: hadud pH of color change: 3. Locate...
Using the literature/accepted Ka value where needed,
calculate the expected pH of the titration mixture:
When 45 mL of NaOH has been added
At the equivalence point
RAW DATA AND OBSERVATIONS Table 1: Titration of acetic acid with O, DRH58 , mol L1 NaOH(aq) (5.5 marks) Concentration of acid: O 080 yeiCo mol L- Colour change: dok pak to qelloo 25.00 methyl-red b.62 mL Volume of acid sample: Indicator: Sharp or gradual change: hadud pH of color change: 3. Locate...
 Given the graph below, identify the volume of the endpoint of the
phosphoric acid and sodium hydroxide titration.
pH vs. Volume Volume de NaOH (m)
Given the graph below, identify the volume of the endpoint of the
phosphoric acid and sodium hydroxide titration.
pH vs. Volume Volume de NaOH (m)
 Part II. 3 UNKNOWN Number: Mass of Acid: 161M NaoH Molarity of NaOH used: 4. Attach the graph of your titration curve with pH vs Volume of NaOH, with proper format and labeling. 5. Calculate the molar mass of your unknown acid using the endpoint for the second step of the reaction between the acid and sodium hydroxide. Show calculations. Molar Mass 6. Write a "B" on your graph to precisely label two points where a buffer exists with similar...
 Plot the titration curve for the following data. (Plot volume of base on the x-axis and pH on the y- axis) Label the equivalence point on your graph. Volume of Base (ml) 1.00 2.00 3.00 4.00 5.00 6.00 7.00 8.00 9.00 10.00 10.50 11.00 11.50 12.00 13.00 14.00 15.00 16.00 16.50 17.00 17.50 18.00 18.50 18.70 18.90 19.10 19.30 20.50 21.00 21.50 pH 3.15 3.24 3.39 3.54 3.63 3.78 3.85 3.98 4.11 4.20 4.26 4.31 4.39 4.47 4.60 4.75 4.90...
 3. What volume of 0.025 M NaOH will be required to reach the endpoint in a titration with 25.00 ml of 0.10 M HCI? Show your work with units and correct significant figures. Circle your answer. 4. Calculate the molarity of a sodium hydroxide solution if 25.00 mL 0.100 M maleic acid requires 22.10 ml of NaOH to reach the endpoint. Show your work with units and correct significant figures. Circle your answer. 5. The following data were collected in...
 a) Use this plot to estimate the volume of NaOH
required to reach the equivalence point of each titration
curve.
b) Estimate the original concentration of weak acid in
solution before strong base was added.
c) Find the midpoint pH for each of the trials using
half the volume of NaOH required to reach the equivalence point for
that trial. Check if this pH is at the most flat part of the
titration curve. This is the pKa of the...
a) Use this plot to estimate the volume of NaOH
required to reach the equivalence point of each titration
curve.
b) Estimate the original concentration of weak acid in
solution before strong base was added.
c) Find the midpoint pH for each of the trials using
half the volume of NaOH required to reach the equivalence point for
that trial. Check if this pH is at the most flat part of the
titration curve. This is the pKa of the...
 PRE-LAB for pH titration of a Strong Acid with Base This is due before the lab begins, Name 1. Calculate the pH of the following solutions: (a) 1 M NaCl Does not dissociate in water to produce either hydrogen or nyot thus it is a neutral Sall, so 7. (b) 1 M HOAc (Ka - 1.8 x 10⁻⁵) duce either hydrogen or hyd xde ion, (c) 1 M NHOH (Kb = 1.8 x 10⁻⁵) (d) 0.1 M NaOAC (e) 0.1...
 Using the literature/accepted Ka value where needed,
calculate the expected pH of the titration mixture:
When 45 mL of NaOH has been added
At the equivalence point
RAW DATA AND OBSERVATIONS Table 1: Titration of acetic acid with O, DRH58 , mol L1 NaOH(aq) (5.5 marks) Concentration of acid: O 080 yeiCo mol L- Colour change: dok pak to qelloo 25.00 methyl-red b.62 mL Volume of acid sample: Indicator: Sharp or gradual change: hadud pH of color change: 3. Locate...
Using the literature/accepted Ka value where needed,
calculate the expected pH of the titration mixture:
When 45 mL of NaOH has been added
At the equivalence point
RAW DATA AND OBSERVATIONS Table 1: Titration of acetic acid with O, DRH58 , mol L1 NaOH(aq) (5.5 marks) Concentration of acid: O 080 yeiCo mol L- Colour change: dok pak to qelloo 25.00 methyl-red b.62 mL Volume of acid sample: Indicator: Sharp or gradual change: hadud pH of color change: 3. Locate...
Most questions answered within 3 hours.
-
#22 Suppose cars pass an intersection at a rate of 120 per hour.
What is the...
asked 12 minutes ago -
for project management course
An indicator of project success within an organization is the
strength of...
asked 18 minutes ago -
How did immigration affect the culture of the United States?
Explain in detail and give specific...
asked 25 minutes ago -
A dolphin in an aquatic show jumps straight up out of the water
at a velocity...
asked 1 hour ago -
x
P(x)
0
0.25
1
0.2
2
0.15
3
0.4
Find the standard deviation of this...
asked 2 hours ago -
An economist claims that he has found evidence to support the
assumption that the investment expenditure...
asked 3 hours ago -
Question 10 (1 point)
Suppose that a researcher studying the weight of female college
athletes wants...
asked 4 hours ago -
a. Using your
molecular modeling kit, build a model of sucrose. Locate the oxygen
bridge in...
asked 4 hours ago -
Below is a
linear time complexity algorithm Max-Min-VER1 to find the biggest
and smallest element a...
asked 4 hours ago -
A women tries to swim perpendicular across the river to the
opposite bank at 2.0m/s with...
asked 5 hours ago -
The amount of time it takes for a student to complete a
statistics quiz is uniformly...
asked 6 hours ago -
True or False: If some system undergoes a reversible,
isothermal
process, then its entropy must remain...
asked 5 hours ago