
Homework Answers
When income increases, the demand for normal goods increases so the demand curve shifts to the right.
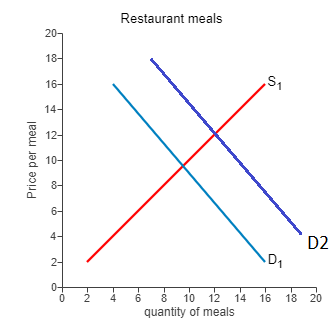
Equilibrium price will increase and the Equilibrium quantity will increase
Add Answer to:
Market Effects of Increased Income. Consider the market for restaurant meals. If consumer income increases, and restaur...
Use the line drawing tool to draw a demand curve shifting to the rightright. Label this...
Use the line drawing tool to draw a demand curve shifting to the rightright. Label this line 'D2'. Carefully follow the instructions above, and only draw the required objects. With this shift, equilibrium price will ▼ and equilibrium quantity will ▼ increase decrease .
The 9/11 terrorist attacks caused the us. arine travel demand curve to shift left by an...
 The 9/11 terrorist attacks caused the us. arine travel demand curve to shift left by an estimated 30% (no and Lee, 2005). Use a supply-and-demand diagram to show the likely effect on price and quantity (assuming that the market is competitive). Consider the market for airline travel lustrated in the figure to the right 1.) Using the line drawing tool, graph a new airline travel demand curve. Label this curve D2 2.) Using the point drawing tool, indicate the new...
Consider the market for snow skiing illustrated in the graph to the right. Suppose that on...
 Consider the market for snow skiing illustrated in the graph to the right. Suppose that on the weekend, demand is D. However, on weekdays, demand becomes D2 If a snow ski resort engages in peak-load pricing, then what prices should it charge? 1.) Using the point drawing tool, identify the profit-maximizing price and quantity on weekends and label it "Weekends'. $/0 2.) Using the point drawing tool, identify the profit-maximizing price and quantity for weekdays and label it 'Weekdays! 3.)...
Consider the market for snow skiing illustrated in the graph to the right. Suppose that on...
 Consider the market for snow skiing illustrated in the graph to the right. Suppose that on the weekend, demand is D. However, on weekdays, demand becomes D2 If a snow ski resort engages in peak-load pricing, then what prices should it charge? 1.) Using the point drawing tool, identify the profit-maximizing price and quantity on weekends and label it "Weekends'. 0/$ 2.) Using the point drawing tool, identify the profit-maximizing price and quantity for weekdays and label it "Weekdays' 3.)...
Consider the market for wheat, depicted in the figure to the right Suppose a price floor...
 Consider the market for wheat, depicted in the figure to the right Suppose a price floor of government is imposed by the As a result of the price floor there is a of wheat Compared with the market clearing equilibrium, is the price floor efficient? What are represents the loss in efficiency in terms of consumer and producer surplus resulting from the price floor? Use the triangle drawing tool to shade in deadweight loss Label this shaded area Deadweight Loss...
The figure to the right represents the market for peaches. Assume the market for peaches is...
 The figure to the right represents the market for peaches. Assume the market for peaches is perfectly competitive and a constant-cost industry. Also assume the industry is initially in long-run equilibrium. Then, the demand for peaches increases, as shown, from D, to D2. Use the line drawing tool to draw the new market supply curve (S2) and the long-run industry supply curve (SLR). Properly label this line. 6.004 Carefully follow the instructions above, and only draw the required objects. Price...
Consider the market represented by the figure to the right. Suppose this market has one firm....
 Consider the market represented by the figure to the right. Suppose this market has one firm. The figure assumes the firm has no fixed costs. 500.00 Suppose the firm is able to capture all consumer surplus by charging different prices to different customers. 450.00 Using the triangle drawing tool, shade in the firm's profits and label it 'Profits'. Carefully follow the instructions above and only draw the required object. Now suppose the firm can only charge a single price. 1.)...
In the market for televisions, the price of a television falls and nothing else changes. Price...
 In the market for televisions, the price of a television falls and nothing else changes. Price (dollars per television) Show the effect of this change o os Choose between the following Use the single arrow tool to draw an arrow on the demand curve showing the direction of movement along the line OR Use the line tool to draw a new demand curve Only one of the effects is correct, and you must determine which is the appropriate one to...
Score: 7 of 8 pts x Question 7: Externalities and Economic Efficiency 21 Question Consider the...
 Score: 7 of 8 pts x Question 7: Externalities and Economic Efficiency 21 Question Consider the market illustrated in the figure to the right Supply Curve S, represents the private cost of production and demand curve Dy represents the private benefit from consumption Suppose production of this good creates a negative externality Show how the externality affects the market 1) Use the line drawing tool to draw either a new supply (52) or demand (D) curve incorporating the negative externality...
Refer to the diagram to the right: 1) Use the line drawing tool to draw a...
 Refer to the diagram to the right: 1) Use the line drawing tool to draw a demand curve that shifts to the right. Label this line 'De 2) Use the line drawing tool to draw a supply curve that shifts to the right by less than the demand line. Label this line 'S 3) Use the point drawing tool to identify the new point of equilibrium. Label this point 'B' Price Carefully follow the instructions above, and only draw the...
 The 9/11 terrorist attacks caused the us. arine travel demand curve to shift left by an estimated 30% (no and Lee, 2005). Use a supply-and-demand diagram to show the likely effect on price and quantity (assuming that the market is competitive). Consider the market for airline travel lustrated in the figure to the right 1.) Using the line drawing tool, graph a new airline travel demand curve. Label this curve D2 2.) Using the point drawing tool, indicate the new...
 Consider the market for snow skiing illustrated in the graph to the right. Suppose that on the weekend, demand is D. However, on weekdays, demand becomes D2 If a snow ski resort engages in peak-load pricing, then what prices should it charge? 1.) Using the point drawing tool, identify the profit-maximizing price and quantity on weekends and label it "Weekends'. $/0 2.) Using the point drawing tool, identify the profit-maximizing price and quantity for weekdays and label it 'Weekdays! 3.)...
 Consider the market for snow skiing illustrated in the graph to the right. Suppose that on the weekend, demand is D. However, on weekdays, demand becomes D2 If a snow ski resort engages in peak-load pricing, then what prices should it charge? 1.) Using the point drawing tool, identify the profit-maximizing price and quantity on weekends and label it "Weekends'. 0/$ 2.) Using the point drawing tool, identify the profit-maximizing price and quantity for weekdays and label it "Weekdays' 3.)...
 Consider the market for wheat, depicted in the figure to the right Suppose a price floor of government is imposed by the As a result of the price floor there is a of wheat Compared with the market clearing equilibrium, is the price floor efficient? What are represents the loss in efficiency in terms of consumer and producer surplus resulting from the price floor? Use the triangle drawing tool to shade in deadweight loss Label this shaded area Deadweight Loss...
 The figure to the right represents the market for peaches. Assume the market for peaches is perfectly competitive and a constant-cost industry. Also assume the industry is initially in long-run equilibrium. Then, the demand for peaches increases, as shown, from D, to D2. Use the line drawing tool to draw the new market supply curve (S2) and the long-run industry supply curve (SLR). Properly label this line. 6.004 Carefully follow the instructions above, and only draw the required objects. Price...
 Consider the market represented by the figure to the right. Suppose this market has one firm. The figure assumes the firm has no fixed costs. 500.00 Suppose the firm is able to capture all consumer surplus by charging different prices to different customers. 450.00 Using the triangle drawing tool, shade in the firm's profits and label it 'Profits'. Carefully follow the instructions above and only draw the required object. Now suppose the firm can only charge a single price. 1.)...
 In the market for televisions, the price of a television falls and nothing else changes. Price (dollars per television) Show the effect of this change o os Choose between the following Use the single arrow tool to draw an arrow on the demand curve showing the direction of movement along the line OR Use the line tool to draw a new demand curve Only one of the effects is correct, and you must determine which is the appropriate one to...
 Score: 7 of 8 pts x Question 7: Externalities and Economic Efficiency 21 Question Consider the market illustrated in the figure to the right Supply Curve S, represents the private cost of production and demand curve Dy represents the private benefit from consumption Suppose production of this good creates a negative externality Show how the externality affects the market 1) Use the line drawing tool to draw either a new supply (52) or demand (D) curve incorporating the negative externality...
 Refer to the diagram to the right: 1) Use the line drawing tool to draw a demand curve that shifts to the right. Label this line 'De 2) Use the line drawing tool to draw a supply curve that shifts to the right by less than the demand line. Label this line 'S 3) Use the point drawing tool to identify the new point of equilibrium. Label this point 'B' Price Carefully follow the instructions above, and only draw the...
Most questions answered within 3 hours.
-
Under the influence of its drive force, a snowmobile is moving
at a constant velocity along...
asked 1 hour ago -
Why do organizations decline? What steps can top
management take to halt, decline, and restore organizational...
asked 1 hour ago -
. Suppose a discrete random variable has probability
distribution
P(x) = .2 if x = 0...
asked 48 minutes ago -
What mechanisms Drive speciation??
(I.e. what was Dawins theory on the orgin of species, and how...
asked 2 hours ago -
The manager at a car assembly plant believes that the mean
assembly time for a car...
asked 3 hours ago -
Which of the following is true of electron capture?
A) It decreases the nuclide's mass number...
asked 5 hours ago -
Assuming an efficiency of 43.10%, calculate the actual yield of
magnesium nitrate formed from 114.9 g...
asked 5 hours ago -
The highly pathogenic bacterium Clostridium
perfringens causes gangrene, a disease that results in the
destruction of...
asked 7 hours ago -
In the context of situation analysis, which of the following is
a category for analysis in...
asked 7 hours ago -
In a study of the gas phase decomposition of sulfuryl chloride
at 600 K SO2Cl2(g)SO2(g) +...
asked 7 hours ago -
75 g of 2-propanol (C3H8O) and 25 g of pentane are mixed in a
200 mL...
asked 7 hours ago -
The 2800-turn coil in a dc motor has an area per turn of 1.1 ×
10-2...
asked 7 hours ago