
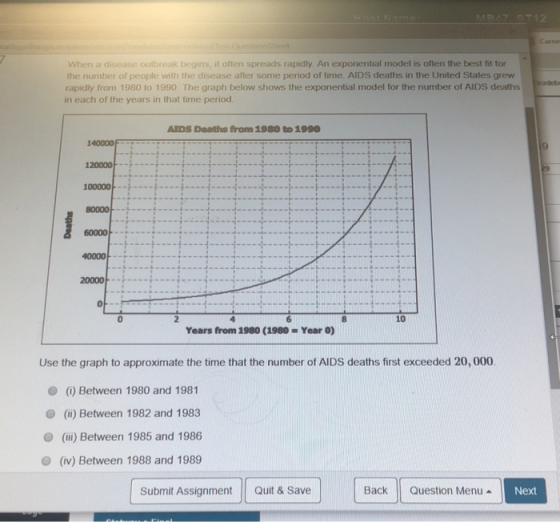

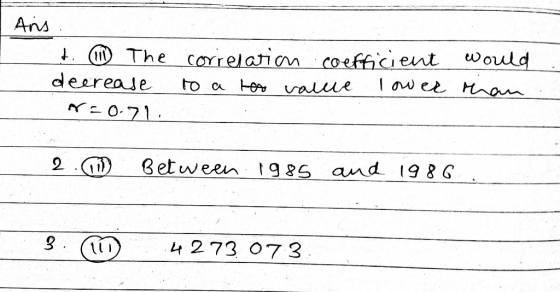
When a disease outbreak begins, it often spreads rapidly An exponential model is often the best fit for the number of people with the disease after some period of time. AIDS deaths in the United States grew rapidly from 1980 to 1990. The graph below shows the exponential model for the number of AIDS deaths in each of the years in that time period AIDS Doaths from 1980 to 1990 140000F 100000 80000 -t…- 10 Years from 1980 (1980 Year 0) Use the graph to approximate the time that the number of AIDS deaths first exceeded 20, 000 O() Between 1980 and 1981 O (i) Between 1982 and 1983 (iii) Between 1985 and 1986 O (iv) Between 1988 and 1989 Submit AssignmentQuit & Save Back | | Question Menu▲ Next
Carnes athpathways.ma adeba Remaining Time: 01:33.36 Cellular phone usage increased in the United States from 1985 to 2010. There were 340, 213 cellular subscibers in the United States in 1985. By 2010, the number of cellular subscribers in the U.S. reached9 300, 520, 098. The cellular subscribers in the U.S in those years can be modeled by the equatiorn: predicted cellular subscribers (in thousands) 340 (1.571)years since 1985 Based on this model, what is the predicted number of cellular phone subscribers in 1993? (0 4273 O (0) 12, 725 O (i) 4, 273, 073 O (iv) 12, 615, 033
Homework Answers
Add Answer to:
Remaining Time: 0134:51 A scatterpot of Y vs X. The scatterplot displays the points: (10,85), (10,86),.(11,86, (1...
FIREARM DEATHS Download the Excel file Firearm.xls for use in this question. The number of deaths...
 FIREARM DEATHS Download the Excel file Firearm.xls for use in
this question. The number of deaths due to firearms in the United
States between 1968 and 1993 are given in the Excel file.
Answer the following using the research hypothesis, "there is a
correlation between year and number of firearm deaths in the
US."
A. What is the value of the correlation coefficient between
year and number of firearm deaths? (Answer to 3 decimal
places)
B. How many degrees of freedom...
FIREARM DEATHS Download the Excel file Firearm.xls for use in
this question. The number of deaths due to firearms in the United
States between 1968 and 1993 are given in the Excel file.
Answer the following using the research hypothesis, "there is a
correlation between year and number of firearm deaths in the
US."
A. What is the value of the correlation coefficient between
year and number of firearm deaths? (Answer to 3 decimal
places)
B. How many degrees of freedom...
1. 2. 3. 4. 5. 6. 7. Shawna reads a scatterplot that displays the relationship between...
 1.
2.
3.
4.
5.
6.
7.
Shawna reads a scatterplot that displays the relationship between the number of cars owned per household and the average number of citizens who have health insurance in neighborhoods across the country. The plot shows a strong positive correlation. Shawna recalls that correlation does not imply causation. In this example, Shawna sees that increasing the number of cars per household would not cause members of her community to purchase health insurance. Identify the lurking...
1.
2.
3.
4.
5.
6.
7.
Shawna reads a scatterplot that displays the relationship between the number of cars owned per household and the average number of citizens who have health insurance in neighborhoods across the country. The plot shows a strong positive correlation. Shawna recalls that correlation does not imply causation. In this example, Shawna sees that increasing the number of cars per household would not cause members of her community to purchase health insurance. Identify the lurking...
The scatterplot below shows Olympic gold medal performances in the long jump from 1900 to 1988. T...
 The scatterplot below shows Olympic gold medal performances in the long jump from 1900 to 1988. The long jump is measured in meters. 9.0 8.8 8.6 8.4 E 8.2 8.0 7.8 -7,6 7.4 0 7.21o 7.0 0 20 40 60 8100 120 Year since 1900 Here is the equation of the least squares regression line Predicted long jump 7.24 + 0.014* year since 1900. What does the vertical-intercept (aka. y-intercept) tell us? 7.24 meters is the predicted value for the...
**R-STUDIO KNOWLEDGE REQUIRED*** PLEASE ANSWER THE FOLLOWING WITH ****R-STUDIO**** CODING- thank ...
 **R-STUDIO KNOWLEDGE REQUIRED***
PLEASE ANSWER THE FOLLOWING WITH ****R-STUDIO****
CODING- thank you so much!!
I am specifically look for the solution to part
***(h)**** and *****(i)***** below using R-Studio
code:
The data set in question
is:
YEAR Height Stories
1990 770 54
1980 677 47
1990 428 28
1989 410 38
1966 371 29
1976 504 38
1974 1136 80
1991 695 52
1982 551 45
1986 550 40
1931 568 49
1979 504 33
1988 560 50
1973 512...
**R-STUDIO KNOWLEDGE REQUIRED***
PLEASE ANSWER THE FOLLOWING WITH ****R-STUDIO****
CODING- thank you so much!!
I am specifically look for the solution to part
***(h)**** and *****(i)***** below using R-Studio
code:
The data set in question
is:
YEAR Height Stories
1990 770 54
1980 677 47
1990 428 28
1989 410 38
1966 371 29
1976 504 38
1974 1136 80
1991 695 52
1982 551 45
1986 550 40
1931 568 49
1979 504 33
1988 560 50
1973 512...
What is the relationship between the number of minutes per day a woman spends talking on...
 What is the relationship between the number of minutes per day a woman spends talking on the phone and the woman's weight? The time on the phone and weight for 9 women are shown in the table below. 28 15 Time Pounds 68 149 22 100 64 124 57 143 67 141 101 77 126 68 127 100 0 a. Find the correlation coefficient: r = Round to 2 decimal places. b. The null and alternative hypotheses for correlation are:...
Concentration of CO2 in the Atmosphere Levels of carbon dioxide (CO2) in the atmosphere are rising...
 Concentration of CO2 in the Atmosphere Levels of carbon dioxide (CO2) in the atmosphere are rising rapidly, far above any levels ever before recorded. Levels were around 278 parts per million in 1800, before the Industrial Age, and had never, in the hundreds of thousands of years before that, gone above 300 ppm. Levels are now nearing 400 ppm. Table 1 shows the rapid rise of CO2 concentrations over the last 50 years, also available in CarbonDioxide.1 We can use...
1.) A researcher hypothesizes that people who spend more time surfing the internet will spend less...
 1.) A researcher hypothesizes that people who spend more time surfing the internet will spend less time socializing in real life situations. He/she measures the relationship between internet use (X; hours per week) and social interaction (Y; hours per week) in a sample of n 10 students. The following table lists the hypothetical results of this study: Internet Use (X) Social Interaction (Y) (X-Mx) (X- MACY-My) (Y-My) 4 09 a 6 6 a 12 2 3 3 6 5 2...
Country Austria 27.8 22.3 44.8 6.8 1.6 10.7 7.4 22.8 35.5 27.2 30.1 50.1 29.0 50.3 35.9 33.8 Neth...
 #1
#2
#4 only dont do #5
12 & 13
Country Austria 27.8 22.3 44.8 6.8 1.6 10.7 7.4 22.8 35.5 27.2 30.1 50.1 29.0 50.3 35.9 33.8 Netherlands Russia United States Source International Social Survey Programme, 2000. Regression and Correlation 467 For a variety of reasons, a larger percentage of people are concerned today about the state of the envi- ronment than in years past. This has led to the formation of environmental action groups that attempt to alter...
#1
#2
#4 only dont do #5
12 & 13
Country Austria 27.8 22.3 44.8 6.8 1.6 10.7 7.4 22.8 35.5 27.2 30.1 50.1 29.0 50.3 35.9 33.8 Netherlands Russia United States Source International Social Survey Programme, 2000. Regression and Correlation 467 For a variety of reasons, a larger percentage of people are concerned today about the state of the envi- ronment than in years past. This has led to the formation of environmental action groups that attempt to alter...
~~~~~~~~~~~~TO BE COMPLETED USING RSTUDIO~~~~~~~~~~~~~~ ~~~~~~~~~~~~(Please display all RCode used)~~~~~~~~~~~~~~ Regression Is there a relationship between...
~~~~~~~~~~~~TO BE COMPLETED USING RSTUDIO~~~~~~~~~~~~~~ ~~~~~~~~~~~~(Please display all RCode used)~~~~~~~~~~~~~~ Regression Is there a relationship between the number of stories a building has and its height? Some statisticians compiled data on a set of n = 60 buildings reported in the World Almanac. You will use the data set to decide whether height (in feet) can be predicted from the number of stories. (a) Load the data from buildings.txt. (Note that this is a text file, so use the appropriate...
 FIREARM DEATHS Download the Excel file Firearm.xls for use in
this question. The number of deaths due to firearms in the United
States between 1968 and 1993 are given in the Excel file.
Answer the following using the research hypothesis, "there is a
correlation between year and number of firearm deaths in the
US."
A. What is the value of the correlation coefficient between
year and number of firearm deaths? (Answer to 3 decimal
places)
B. How many degrees of freedom...
FIREARM DEATHS Download the Excel file Firearm.xls for use in
this question. The number of deaths due to firearms in the United
States between 1968 and 1993 are given in the Excel file.
Answer the following using the research hypothesis, "there is a
correlation between year and number of firearm deaths in the
US."
A. What is the value of the correlation coefficient between
year and number of firearm deaths? (Answer to 3 decimal
places)
B. How many degrees of freedom...
 1.
2.
3.
4.
5.
6.
7.
Shawna reads a scatterplot that displays the relationship between the number of cars owned per household and the average number of citizens who have health insurance in neighborhoods across the country. The plot shows a strong positive correlation. Shawna recalls that correlation does not imply causation. In this example, Shawna sees that increasing the number of cars per household would not cause members of her community to purchase health insurance. Identify the lurking...
1.
2.
3.
4.
5.
6.
7.
Shawna reads a scatterplot that displays the relationship between the number of cars owned per household and the average number of citizens who have health insurance in neighborhoods across the country. The plot shows a strong positive correlation. Shawna recalls that correlation does not imply causation. In this example, Shawna sees that increasing the number of cars per household would not cause members of her community to purchase health insurance. Identify the lurking...
 The scatterplot below shows Olympic gold medal performances in the long jump from 1900 to 1988. The long jump is measured in meters. 9.0 8.8 8.6 8.4 E 8.2 8.0 7.8 -7,6 7.4 0 7.21o 7.0 0 20 40 60 8100 120 Year since 1900 Here is the equation of the least squares regression line Predicted long jump 7.24 + 0.014* year since 1900. What does the vertical-intercept (aka. y-intercept) tell us? 7.24 meters is the predicted value for the...
 **R-STUDIO KNOWLEDGE REQUIRED***
PLEASE ANSWER THE FOLLOWING WITH ****R-STUDIO****
CODING- thank you so much!!
I am specifically look for the solution to part
***(h)**** and *****(i)***** below using R-Studio
code:
The data set in question
is:
YEAR Height Stories
1990 770 54
1980 677 47
1990 428 28
1989 410 38
1966 371 29
1976 504 38
1974 1136 80
1991 695 52
1982 551 45
1986 550 40
1931 568 49
1979 504 33
1988 560 50
1973 512...
**R-STUDIO KNOWLEDGE REQUIRED***
PLEASE ANSWER THE FOLLOWING WITH ****R-STUDIO****
CODING- thank you so much!!
I am specifically look for the solution to part
***(h)**** and *****(i)***** below using R-Studio
code:
The data set in question
is:
YEAR Height Stories
1990 770 54
1980 677 47
1990 428 28
1989 410 38
1966 371 29
1976 504 38
1974 1136 80
1991 695 52
1982 551 45
1986 550 40
1931 568 49
1979 504 33
1988 560 50
1973 512...
 What is the relationship between the number of minutes per day a woman spends talking on the phone and the woman's weight? The time on the phone and weight for 9 women are shown in the table below. 28 15 Time Pounds 68 149 22 100 64 124 57 143 67 141 101 77 126 68 127 100 0 a. Find the correlation coefficient: r = Round to 2 decimal places. b. The null and alternative hypotheses for correlation are:...
 Concentration of CO2 in the Atmosphere Levels of carbon dioxide (CO2) in the atmosphere are rising rapidly, far above any levels ever before recorded. Levels were around 278 parts per million in 1800, before the Industrial Age, and had never, in the hundreds of thousands of years before that, gone above 300 ppm. Levels are now nearing 400 ppm. Table 1 shows the rapid rise of CO2 concentrations over the last 50 years, also available in CarbonDioxide.1 We can use...
 1.) A researcher hypothesizes that people who spend more time surfing the internet will spend less time socializing in real life situations. He/she measures the relationship between internet use (X; hours per week) and social interaction (Y; hours per week) in a sample of n 10 students. The following table lists the hypothetical results of this study: Internet Use (X) Social Interaction (Y) (X-Mx) (X- MACY-My) (Y-My) 4 09 a 6 6 a 12 2 3 3 6 5 2...
 #1
#2
#4 only dont do #5
12 & 13
Country Austria 27.8 22.3 44.8 6.8 1.6 10.7 7.4 22.8 35.5 27.2 30.1 50.1 29.0 50.3 35.9 33.8 Netherlands Russia United States Source International Social Survey Programme, 2000. Regression and Correlation 467 For a variety of reasons, a larger percentage of people are concerned today about the state of the envi- ronment than in years past. This has led to the formation of environmental action groups that attempt to alter...
#1
#2
#4 only dont do #5
12 & 13
Country Austria 27.8 22.3 44.8 6.8 1.6 10.7 7.4 22.8 35.5 27.2 30.1 50.1 29.0 50.3 35.9 33.8 Netherlands Russia United States Source International Social Survey Programme, 2000. Regression and Correlation 467 For a variety of reasons, a larger percentage of people are concerned today about the state of the envi- ronment than in years past. This has led to the formation of environmental action groups that attempt to alter...
Most questions answered within 3 hours.
-
Which of the following pairs of ions have the same electron
configuration?
I: Br− and Se2−...
asked 6 minutes ago -
The Foremost Composite Materials Company is planning a two-day
sales conference for October 19-20. The conference...
asked 29 minutes ago -
3) Illustrate the observed pattern of relatedness of organisms
versus adaptations to specific conditions. This means...
asked 46 minutes ago -
In winter a lake has a 0.35 m thick ice layer over 1.10 m of
water....
asked 1 hour ago -
Assuming the following has been encrypted with a Vigenere cipher
below, use the method(s) and assumptions...
asked 2 hours ago -
How would I use switch statements to write a program that will
take an input of...
asked 1 hour ago -
Imagine a reaction in which methane gas combusts at a constant
pressure of 1 atm and...
asked 2 hours ago -
Two parallel wires (each 12 m in length) are separated by a
distance of 0.065 m...
asked 2 hours ago -
Suppose there were three masses at the corner of uniform
equilateral triangle. The masses are m1...
asked 2 hours ago -
Situation: A building that is 618 m above the ground floor. How
many times would a...
asked 2 hours ago -
help me and discuss one successful and one
unsuccessful international company/busines in Indonesia.whyit
succeed and why...
asked 2 hours ago -
I- Choose the best answer
Which of the following statements about the structure and
packaging of...
asked 2 hours ago