
Homework Answers


Add Answer to:
17) FACTOR B Level 1 2 3 FACTOR A 1 4.1, 4.1 5.0,5.2 6.3, 6.1 8.8,9.0 2 5.8, 5.6 5.0, 5.4 Calculate the mean response f...
A two-factor ANOVA was perofrmed with a-2, b-2, and r-3. The following are the data Male Female L...
 A two-factor ANOVA was perofrmed with a-2, b-2, and r-3. The following are the data Male Female Less than bachelor's degree 15 10 6 12 10 At least one bachelor's degree 10 (a) Complete the ANOVA table F-statistics F-MS(A)/MSE F-MS(B)/MSE Variation df Mean squares SS(A) SS(B) (a-1) (b-1) SS(AB) SSE MS(A) MS(B) Factor A (Gender) a Factor B (Education)a-1 Interaction MS(AB) F-MS(AB)/MSE rror l-a MSE Total n- SS(Total) (b) Write down Ho and H and determine whether there are differences...
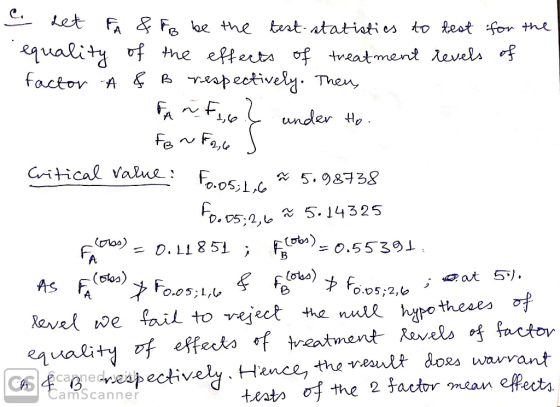
The following two-way table gives data for a 2 × 2 factorial experiment with two observations per factor-level combination:
 The following two-way table gives data for a 2 × 2 factorial experiment with two
observations
per factor-level combination: The data are saved in the LM.TXT file. Factor B
Level 1 2
Factor A 1 29.6, 35.2 47.3, 42.1
2 12.9, 17.6 28.4, 22.7 a. Identify the treatments for this experiment. Calculate and plot the treatment means, using
the response variable as y-axis and the levels of factor B as the x-axis. Use the levels of
factor A as plotting symbols. Do...
The following two-way table gives data for a 2 × 2 factorial experiment with two
observations
per factor-level combination: The data are saved in the LM.TXT file. Factor B
Level 1 2
Factor A 1 29.6, 35.2 47.3, 42.1
2 12.9, 17.6 28.4, 22.7 a. Identify the treatments for this experiment. Calculate and plot the treatment means, using
the response variable as y-axis and the levels of factor B as the x-axis. Use the levels of
factor A as plotting symbols. Do...
please show work for each! ΑΙ Factor B B. B2 T = 40 T = 10...
 please show work for each!
ΑΙ Factor B B. B2 T = 40 T = 10 M=4 M= 1 SS-50 SS = 30 Factor A A2 T-50 M=5 SS - 60 T = 20 M = 2 SS = 40 N-40 G = 120 EX =640 Use a two-way ANOVA with a=0.05 to evaluate the main effects and the interaction. m Source SS df MS F Between treatments | 1 6.67 I 2.00 Factor A (ROWS) 18.00 Factor B (COLUMNS)...
please show work for each!
ΑΙ Factor B B. B2 T = 40 T = 10 M=4 M= 1 SS-50 SS = 30 Factor A A2 T-50 M=5 SS - 60 T = 20 M = 2 SS = 40 N-40 G = 120 EX =640 Use a two-way ANOVA with a=0.05 to evaluate the main effects and the interaction. m Source SS df MS F Between treatments | 1 6.67 I 2.00 Factor A (ROWS) 18.00 Factor B (COLUMNS)...
Please answer questions 1-6 showing all work. thank you!!! U be X, X A- 1.A Abdee...
 Please answer questions 1-6 showing all work. thank
you!!!
U be X, X A- 1.A Abdee ABCD AaBbCcDc AB No Spacing Heading He and Edit Buy Office or sign in to activate Office if you've already bought it The following results are from an independent-measures, two-factor, study with n=10 participants in each treatment condition. A: B T40 M-4 SS50 Factor B B T= 10 M-1 SS-30 Factor A A T-50 M-5 SS=60 T = 20 M-2 SS-40 N-40 G-120 EX2...
Please answer questions 1-6 showing all work. thank
you!!!
U be X, X A- 1.A Abdee ABCD AaBbCcDc AB No Spacing Heading He and Edit Buy Office or sign in to activate Office if you've already bought it The following results are from an independent-measures, two-factor, study with n=10 participants in each treatment condition. A: B T40 M-4 SS50 Factor B B T= 10 M-1 SS-30 Factor A A T-50 M-5 SS=60 T = 20 M-2 SS-40 N-40 G-120 EX2...
You can assume that the data followed all three assumptions for ANOVA analysis, namely, independence, equal...
You can assume that the data followed all three assumptions for ANOVA analysis, namely, independence, equal variance, and normality. Placebo Dose2 Dose5 4.3 3.7 1.3 9.1 3.5 1 6.1 5.2 0.7 4.7 9.3 1.2 4.1 6.7 1.3 7.8 5.2 1.6 5.7 4.1 2.4 5.8 5.3 1.9 Here is my ANOVA table SUMMARY Groups Count Mean Std Dev Placebo 8 5.95 1.74 Dose2 8 5.375 1.90 Dose5 8 1.425 0.53 Results Source of Variation SS df MS F P-value Between 97.41...
(2 points) Use the Minitab display to test the claims using the significance level of a...
 (2 points) Use the Minitab display to test the claims using the significance level of a = 0.05. The sample data are the numbers of support beams manufactured by 4 different operators using 4 different machines. Assume that there is no interaction effect from operator and machine. Analysis of Variance for Beams Source DF SS MS F P Operator 3 59.18 20.06 2.59 0.118 Machine 93.51 46.12 5.95 0.016 Error 9 47.75 7.75 Total 15 200.44 3 1. Test the...
Aa Aa 11. Two-factor ANOVA Emphasis on calculations W.Thomas Boyce, a professor and pediatrician at the University of British Columbia, Vancouver, has studied interactions between individual differen...
 Aa Aa 11. Two-factor ANOVA Emphasis on calculations W.Thomas Boyce, a professor and pediatrician at the University of British Columbia, Vancouver, has studied interactions between individual differences in physiology and differences in experience in determining health and well-being. Dr. Boyce found that some children are more sensitive to their environments. They do exceptionally wel when the environment is suppo「tive but are much more likely to have mental and physical health problems when the environment has challenges. You decide to do...
Each of J = 2 operators were asked to make K = 2 independent measurements on...
 Each of J = 2 operators were asked to make K = 2 independent measurements on / = 10 injection-molded parts during production. A two-way-interaction ANOVA table for analyzing the data is given below. Responses were 0.001 mm above the nominal value of 685 mm. Source df SS MS F P-value A = Part 9 11750 1305.5 ? 6.06e-05 B = Operator 1 648 648.0 ? 0.0603 AB Interaction 9 2538 282.0 0.1484 Error 20 3269 163.5 Total 39 18205...
A counseling psychologist is interested in three types of therapy for modifying snake phobia. However, she...
A counseling psychologist is interested in three types of therapy for modifying snake phobia. However, she does not believe that one type of therapy is necessarily best for everyone; instead, the best type might depend on the severity of the phobia. Undergraduate students enrolled in an introductory psychology course who volunteer are given the Fear Schedule Survey (FSS) to screen out those who show no fear of snakes. Those displaying some fear are classified as either mildly, moderately, or severely...
12. Measuring effect size for two-factor ANOVA It is projected that approximately 580,000 veteran...
12. Measuring effect size for two-factor ANOVA It is projected that approximately 580,000 veterans will take advantage of the GI Bill for the 21st Century. Boots to Books is a course for all veterans, current military members, and their family members, friends, and supporters. The goal of Boots to Books is to assist deployed, postdeployed, and veteran students in making a positive transition from military to civilian life or from deployment to postdeployment life, including the acquisition of college survival...
 A two-factor ANOVA was perofrmed with a-2, b-2, and r-3. The following are the data Male Female Less than bachelor's degree 15 10 6 12 10 At least one bachelor's degree 10 (a) Complete the ANOVA table F-statistics F-MS(A)/MSE F-MS(B)/MSE Variation df Mean squares SS(A) SS(B) (a-1) (b-1) SS(AB) SSE MS(A) MS(B) Factor A (Gender) a Factor B (Education)a-1 Interaction MS(AB) F-MS(AB)/MSE rror l-a MSE Total n- SS(Total) (b) Write down Ho and H and determine whether there are differences...
 please show work for each!
ΑΙ Factor B B. B2 T = 40 T = 10 M=4 M= 1 SS-50 SS = 30 Factor A A2 T-50 M=5 SS - 60 T = 20 M = 2 SS = 40 N-40 G = 120 EX =640 Use a two-way ANOVA with a=0.05 to evaluate the main effects and the interaction. m Source SS df MS F Between treatments | 1 6.67 I 2.00 Factor A (ROWS) 18.00 Factor B (COLUMNS)...
please show work for each!
ΑΙ Factor B B. B2 T = 40 T = 10 M=4 M= 1 SS-50 SS = 30 Factor A A2 T-50 M=5 SS - 60 T = 20 M = 2 SS = 40 N-40 G = 120 EX =640 Use a two-way ANOVA with a=0.05 to evaluate the main effects and the interaction. m Source SS df MS F Between treatments | 1 6.67 I 2.00 Factor A (ROWS) 18.00 Factor B (COLUMNS)...
 Please answer questions 1-6 showing all work. thank
you!!!
U be X, X A- 1.A Abdee ABCD AaBbCcDc AB No Spacing Heading He and Edit Buy Office or sign in to activate Office if you've already bought it The following results are from an independent-measures, two-factor, study with n=10 participants in each treatment condition. A: B T40 M-4 SS50 Factor B B T= 10 M-1 SS-30 Factor A A T-50 M-5 SS=60 T = 20 M-2 SS-40 N-40 G-120 EX2...
Please answer questions 1-6 showing all work. thank
you!!!
U be X, X A- 1.A Abdee ABCD AaBbCcDc AB No Spacing Heading He and Edit Buy Office or sign in to activate Office if you've already bought it The following results are from an independent-measures, two-factor, study with n=10 participants in each treatment condition. A: B T40 M-4 SS50 Factor B B T= 10 M-1 SS-30 Factor A A T-50 M-5 SS=60 T = 20 M-2 SS-40 N-40 G-120 EX2...
 (2 points) Use the Minitab display to test the claims using the significance level of a = 0.05. The sample data are the numbers of support beams manufactured by 4 different operators using 4 different machines. Assume that there is no interaction effect from operator and machine. Analysis of Variance for Beams Source DF SS MS F P Operator 3 59.18 20.06 2.59 0.118 Machine 93.51 46.12 5.95 0.016 Error 9 47.75 7.75 Total 15 200.44 3 1. Test the...
 Aa Aa 11. Two-factor ANOVA Emphasis on calculations W.Thomas Boyce, a professor and pediatrician at the University of British Columbia, Vancouver, has studied interactions between individual differences in physiology and differences in experience in determining health and well-being. Dr. Boyce found that some children are more sensitive to their environments. They do exceptionally wel when the environment is suppo「tive but are much more likely to have mental and physical health problems when the environment has challenges. You decide to do...
 Each of J = 2 operators were asked to make K = 2 independent measurements on / = 10 injection-molded parts during production. A two-way-interaction ANOVA table for analyzing the data is given below. Responses were 0.001 mm above the nominal value of 685 mm. Source df SS MS F P-value A = Part 9 11750 1305.5 ? 6.06e-05 B = Operator 1 648 648.0 ? 0.0603 AB Interaction 9 2538 282.0 0.1484 Error 20 3269 163.5 Total 39 18205...
Most questions answered within 3 hours.
-
Company AAA produces only one product which other manufacturers
purchase as a component for their final...
asked 36 minutes ago -
An
item can be appended to an array-based list, provided the lenght is
less than the...
asked 36 minutes ago -
Two particles each have a rest mass energy of 30 MeV and are
traveling with a...
asked 2 hours ago -
why
is vectorization a faster alternative to loops?
asked 3 hours ago -
General Matter’s outstanding bond issue has a coupon rate of
11.8%, and it sells at a...
asked 3 hours ago -
Write a one page essay on how important is it to know your basic
accounting knowledge...
asked 3 hours ago -
You are a Senior Civil Engineer posted at the Contracts and
Procurement Division of the Ministry...
asked 3 hours ago -
When using the percentage of completion method, the
company
- recognizes revenues and gross profit each...
asked 4 hours ago -
Is a level production strategy suitable for a pure service
industry, such as professional accounting and...
asked 4 hours ago -
Baker Industries’ net income is $23000, its interest expense is
$4000, and its tax rate is...
asked 4 hours ago -
a) A proton moves at 500 m/s in a 2 T magnetic field. What is
the...
asked 4 hours ago -
Anderson Systems is considering a project that has the following
cash flow and WACC data. What...
asked 4 hours ago