


Step 2: Collect the Data Are the criteria for approximate normality met for the sampling distribution of differences? 4 Determine the following: The mean of the sample differences, The standard deviation of the sample differences, and The number of data pairs in the sample, n. Is the mean of sample differences consistent with your alternative hypothesis? 6 Step 3: Assess the Evidence Calculate the test statistic for your observed mean of sample differences. 7 Sketch the T-distribution. Identify the position of the observed test statistic. Shade the area that 8 represents the P-value. LO
9 Use the test statistic to determine the P-value. Step 4: State a Conclusion 10 How does the P-value compare to the significance level? Should we reject or fail to reject the null hypothesis? 11 What can we conclude about the alternative hypothesis? 12 State a conclusion in context.
Homework Answers

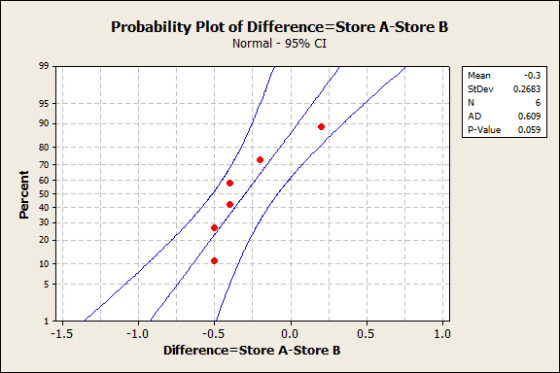
From above plot and p-value>0.05 so the criteria for approximate normality is met.

8.

Add Answer to:
Comparing Grocery Prices Consumer groups often analyze store prices and compare the price of similar items...
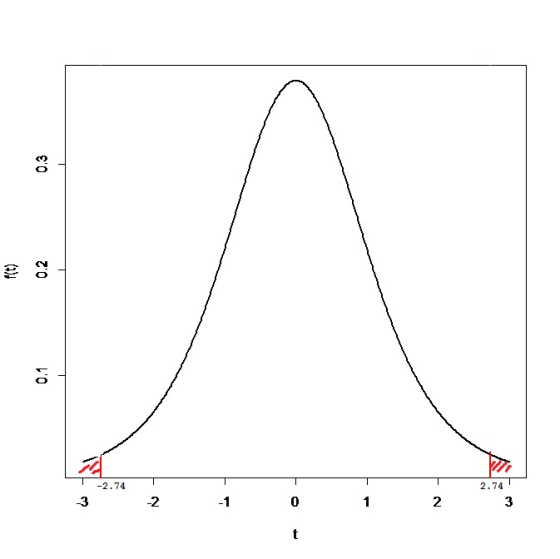
Here are some prices for randomly selected grocery items from the grocery store: Items Prices: Cheese...
Here are some prices for randomly selected grocery items from the grocery store: Items Prices: Cheese $3.29 Butter $4.99 Eggs $3.49 Yogurt $3.49 Juice $3.89 Tea $3.69 Chips $3.99 Soda $1.99 Pastry $2.99 Cerrial $4.99 Oats $3.29 Almond Milk $2.79 Almonds $4.39 Popcorn $3.29 Crackers $3.59 Ice Cream $6.99 Cookies $2.99 Jam $3.69 Peanut Butter $3.29 Coffee $3.19 Green Tea $4.99 BBQ Sauce $2.99 Oil $6.69 Mayonnaise $4.59 Mustard $2.99 1. Compute the sample mean x and the sample standard...
Some grocery stores run big sales on selected items, but regular pricing is higher. Some have...
 Some grocery stores run big sales on selected items, but regular pricing is higher. Some have better every-day pricing but then run fewer sales. Amid COVID-19 pandemic, a consumer agency decided to test if the mean grocery prices are significantly different among the three popular grocery chains in Edmonton and Calgary. The weekly total for four consecutive weeks (rounded to the nearest dollar) based on the prices of 100 every-day use items for each of the stores is provided in...
13. Most people have returned clothing or other items to stores. Acme holding company is particularly...
 13. Most people have returned clothing or other items to stores. Acme holding company is particularly interested in the clothes that have been returned after the winter holidays. It requires its stores to keep records of these clothes if they cost over $75.00. Acme's corporate office is worried about a new store (N) it recently purchased. The store seems to have a high proportion of returns compared to an established store (E) in a similar neighborhood. After the last holiday...
A study was designed to compare the attitudes of two groups of nursing students towards computers. Group 1 had previousl...
A study was designed to compare the attitudes of two groups of nursing students towards computers. Group 1 had previously taken a statistical methods course that involved significant computer interaction. Group 2 had taken a statistic methods course that did not use computers. The students' attitudes were measured by administering the Computer Anxiety Rating Scale (CARS). A random sample of 16 nursing students from Group 1 resulted in a mean score of 41.3 with a standard deviation of 2.5. A...
The price of 30 random foods were compared between two different superstore chains. The prices for...
 The price of 30 random foods were compared between two different superstore chains. The prices for the products are shown in the accompanying data table. Complete parts (a) through (c) below. Click the icon to view the data table for the prices of the products. a. At the 0.01 level of significance, is there evidence that the mean price of items is higher at store A than at store B? Let Hy be the mean prices at store A and...
In an annual report to investors, an investment firm claims that the share price of one...
In an annual report to investors, an investment firm claims that the share price of one of their bond funds had very little variability. The report shows the average price as $$12.00 with a variance of 0.22. One of the investors wants to investigate this claim. He takes a random sample of the share prices for 25 days throughout the last year and finds that the standard deviation of the share price is 0.1616. Can the investor conclude that the...
An article from a consumer comparison website compared the price of several items available in both...
 An article from a consumer comparison website compared the price of several items available in both conventional supermarkets and warehouse stores. Complete parts a thr below EB Click the icon to view the item prices. Click the icon to view an excerpt from a table of critical values of the studentized range. a. Choose the most appropriate ANOVA procedure using a 0.05 to determine if a difference exists in the average price of these items at the four stores. What...
Consumer Reports uses a 100-point customer satisfaction score to rate the nation's major chain stores. Assume...
 Consumer Reports uses a 100-point customer satisfaction score to rate the nation's major chain stores. Assume that from past experience with the satisfaction rating score, a population standard deviation of a 14 is expected. In 2012. Costco, with its 432 warehouses in 40 states, was the only chain store to cam an outstanding rating for overall quality. A sample of 15 Costco customer satisfaction scores follows 95 908375 95 83 82 93 94 6462 (a) What is the sample mean...
Do convenience stores charge a high price for convenience Specifically are the prices idher than a...
 Do convenience stores charge a high price for convenience Specifically are the prices idher than a large box store, such as Walmart? You decide to investigate this question by gathering data on on the prices of 10 goods from a convenience store and from Walmart. You enter the data in the following spreadsheet: be the population Let me be the population mean price of a good at the convenience store, and mean price of a good at Walmart. What are...
A study was designed to compare the attitudes of two groups of nursing students towards computers....
A study was designed to compare the attitudes of two groups of nursing students towards computers. Group 1 had previously taken a statistical methods course that involved significant computer interaction. Group 2 had taken a statistic methods course that did not use computers. The students' attitudes were measured by administering the Computer Anxiety Rating Scale (CARS). A random sample of 1111 nursing students from Group 1 resulted in a mean score of 40.840.8 with a standard deviation of 5.45.4. A...
 Some grocery stores run big sales on selected items, but regular pricing is higher. Some have better every-day pricing but then run fewer sales. Amid COVID-19 pandemic, a consumer agency decided to test if the mean grocery prices are significantly different among the three popular grocery chains in Edmonton and Calgary. The weekly total for four consecutive weeks (rounded to the nearest dollar) based on the prices of 100 every-day use items for each of the stores is provided in...
 13. Most people have returned clothing or other items to stores. Acme holding company is particularly interested in the clothes that have been returned after the winter holidays. It requires its stores to keep records of these clothes if they cost over $75.00. Acme's corporate office is worried about a new store (N) it recently purchased. The store seems to have a high proportion of returns compared to an established store (E) in a similar neighborhood. After the last holiday...
 The price of 30 random foods were compared between two different superstore chains. The prices for the products are shown in the accompanying data table. Complete parts (a) through (c) below. Click the icon to view the data table for the prices of the products. a. At the 0.01 level of significance, is there evidence that the mean price of items is higher at store A than at store B? Let Hy be the mean prices at store A and...
 An article from a consumer comparison website compared the price of several items available in both conventional supermarkets and warehouse stores. Complete parts a thr below EB Click the icon to view the item prices. Click the icon to view an excerpt from a table of critical values of the studentized range. a. Choose the most appropriate ANOVA procedure using a 0.05 to determine if a difference exists in the average price of these items at the four stores. What...
 Consumer Reports uses a 100-point customer satisfaction score to rate the nation's major chain stores. Assume that from past experience with the satisfaction rating score, a population standard deviation of a 14 is expected. In 2012. Costco, with its 432 warehouses in 40 states, was the only chain store to cam an outstanding rating for overall quality. A sample of 15 Costco customer satisfaction scores follows 95 908375 95 83 82 93 94 6462 (a) What is the sample mean...
 Do convenience stores charge a high price for convenience Specifically are the prices idher than a large box store, such as Walmart? You decide to investigate this question by gathering data on on the prices of 10 goods from a convenience store and from Walmart. You enter the data in the following spreadsheet: be the population Let me be the population mean price of a good at the convenience store, and mean price of a good at Walmart. What are...
Most questions answered within 3 hours.
-
A football with a mass of 1.2 kg is kicked from ground level to
a height...
asked 27 seconds from now -
Why is the answer b), for this question? I came up with C) for
my incorrect...
asked 4 minutes ago -
Suppose that you know that in the population of full-time
employees in the United States, the...
asked 26 minutes ago -
This experiment was designed originally to sample various meat and carcass quality
aspects of Ontario pigs...
asked 26 minutes ago -
Dopamine Hydrochloride: draw the structure And Show the
functional groups in different colors and label the...
asked 18 minutes ago -
A rope supports a 10 kg dumbbell hanging from it. What is the
tension in the...
asked 18 minutes ago -
) Raw materials are studied for contamination. Suppose that
the number of particles of contamination per...
asked 40 minutes ago -
After running a regression analysis we calculated an F test and
the significance level was 0.15....
asked 36 minutes ago -
----Can someone please help me solve this one using JAVA
----I thank you in advance
Create...
asked 41 minutes ago -
1. What force primarily attracts the potassium ion to
the nitrate ion?
a. London forces...
asked 42 minutes ago -
What are the negative effects of abruptly stopping the use of
all fossil fuels? Give at...
asked 49 minutes ago -
Given that many conflict are the result of different parties having
different interests, is it possible...
asked 54 minutes ago