The weekly sales figures for the previous year for a new board game are given below....
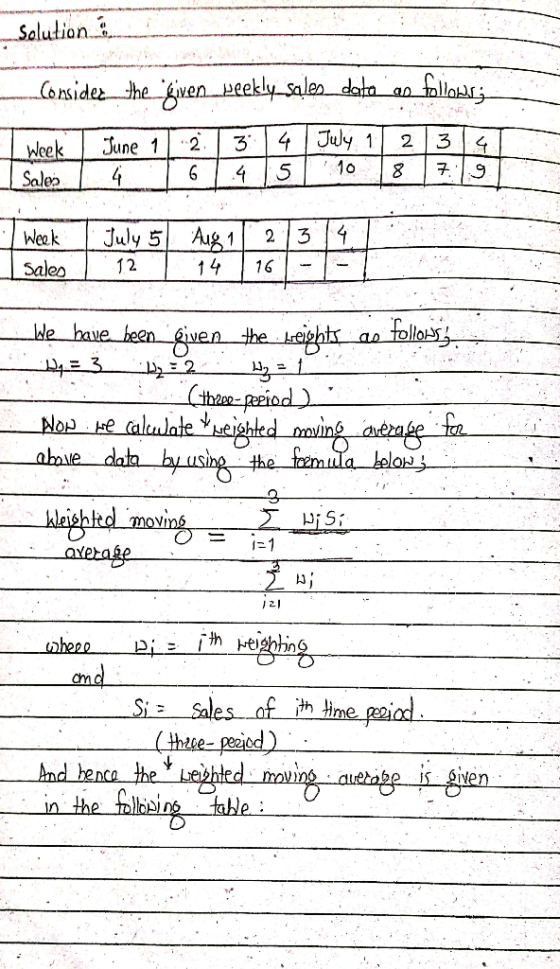
The weekly sales figures for the previous year for a new board game are given below. Assuming a weighting of 3, 2, 1, determine the three-period weighted moving average forecast for the second week in July.
|
WEEK |
June 1 |
2 |
3 |
4 |
July 1 |
2 |
3 |
4 |
5 |
Aug 1 |
2 |
3 |
4 |
|
SALES |
4 |
6 |
4 |
5 |
10 |
8 |
7 |
9 |
12 |
14 |
16 |
Homework Answers

Add Answer to:
The weekly sales figures for the previous year for a new board game are given below....
National Scan, Inc., sells radio frequency inventory tags. Monthly sales for a seven-month period were as...
National Scan, Inc., sells radio frequency inventory tags. Monthly sales for a seven-month period were as follows: Month Sales (000)Units Feb. 17 Mar. 20 Apr. 14 May. 22 Jun. 21 Jul. 25 Aug. 29 b. Forecast September sales volume using each of the following: (1) A linear trend equation.(Round your intermediate calculations and final answer to 2 decimal places.) Yt _ thousands (2) A five-month moving average. (Round your answer to 2 decimal places.) Moving average _ thousands...
Forecast September sales volume using each of the following:
 b. Forecast September sales volume using each of the following: (1) (Omitted) (2) A five-month moving average.(3) Exponential smoothing with a smoothing constant equal to .20, assuming a March forecast of 16(000).(4) The naive approach (5) A weighted average using .60 for August, .10 for July, and .30 for June.
Problem 2: Forecasting (10 points) Given these sales figures over the last 6 weeks, your boss...
 Problem 2: Forecasting (10 points) Given these sales figures over the last 6 weeks, your boss needs you to test two different forecasting methods (parts a and b below) to determine which method is best. For your measure of "best", recommend to your boss that the company should use the method with the lowest mean absolute deviation (MAD). Then use that method to provide your forecast for week 7 in part c. Week >WN Unit Sold 523 587 622 601...
National Scan Inc. sells radio frequency inventory tags. Monthly sales for a seven-month period were as...
National Scan Inc. sells radio frequency inventory tags. Monthly sales for a seven-month period were as follows: Month Sales (000) Units Feb 19 Mar 18 Apr 15 May 20 Jun 18 Jul 22 Aug 20 b. Forecast September sales volume using each of the following: SHOW WORKS!!!! (1) Thenaiveapproach. (2) A five month moving average. (3) A weighted average using .60 for August, .30 for July, and .10 for June. (4) Exponential smoothing with a smoothing constant equal to .20,...
National Scan, Inc., sells radio frequency inventory tags. Monthly sales for a seven-month period were as...
National Scan, Inc., sells radio frequency inventory tags. Monthly sales for a seven-month period were as follows: MonthSales(000)UnitsFeb.15Mar.18Apr.12May.20Jun.23Ju1.23Aug -27b. Forecast September sales volume using each of the following: (1)A linear trend equation.(2) A five-month moving average. (3) Exponential smoothing with a smoothing constant equal to .25, assuming a March forecast of 17(000).(4) The naive approach. (5) A weighted average using.55 for August, .10 for July, and .35 for June.
Problem 2: Forecasting (10 points) Given these sales figures over the last 6 weeks, your boss needs you to test two...
 Problem 2: Forecasting (10 points) Given these sales figures over the last 6 weeks, your boss needs you to test two different forecasting methods (parts a and b below) to determine which method is best. For your measure of "best", recommend to your boss that the company should use the method with the lowest mean absolute deviation (MAD). Then use that method to provide your forecast for week 7 in part c. Week UWN Unit Sold 523 587 622 601...
Actual sales of TV's for the first six month in 2021 were as follows: January 60 ...
Actual sales of TV's for the first six month in 2021 were as follows: January 60 February 80 March 42 April 68 May 44 June 72 Use this information and determine in whole numbers: 1 The average actual monthly sales for that period 2 Trends: Reduce this average by 6% per month for the next three months 3 Simple Moving Average (SMA): make a forecast for July using a three months simple moving average. 4 Weighted Moving Average (WMA): make...
Problem 3-2 National Scan, Inc., sells radlo frequency Inventory tags. Monthly sales for a seven-month period...
 Problem 3-2 National Scan, Inc., sells radlo frequency Inventory tags. Monthly sales for a seven-month period were as follows: Sales Month(ee)Units Feb Mar Apr May Jun Jul Aug 2e 23 25 18 28 30 b. Forecast September sales volume using each of the folloWng: (1 A linear trend equation.(Round your Intermedlate calculatlons and final answer to 2 declmal places.) Yt thousands (2) A five-month moVing average. (Round your answer to 2 declmal places.) Moving averagehousands (3) Exponentlal smoothing with a...
Weekly sales of the Weber Dicamatic food processor for the past ten weeks have been: Week...
Weekly sales of the Weber Dicamatic food processor for the past ten weeks have been: Week Sales Week Sales 1 980 6 990 2 1040 7 1030 3 1120 8 1260 4 1050 9 1240 5 960 10 1100 Determine, on the basis of minimizing the mean square error, whether a three-period or four-period simple moving average model gives a better forecast for this problem.
Need some help with this operations management question. It'd also be nice if you could explain...
 Need some help with this operations management question. It'd
also be nice if you could explain how you got your answer. Thanks.
National Scan, Inc., sells radio frequency inventory tags. Monthly sales for a seven-month period were as follows: Month Feb Mar Sales (000)Units 16 15 12 May Jun Jul Aug 19 23 25 b. Forecast September sales volume using each of the following (1) A linear trend equation. (Round your intermediate calculations and final answer to 2 decimal places.)...
Need some help with this operations management question. It'd
also be nice if you could explain how you got your answer. Thanks.
National Scan, Inc., sells radio frequency inventory tags. Monthly sales for a seven-month period were as follows: Month Feb Mar Sales (000)Units 16 15 12 May Jun Jul Aug 19 23 25 b. Forecast September sales volume using each of the following (1) A linear trend equation. (Round your intermediate calculations and final answer to 2 decimal places.)...
 b. Forecast September sales volume using each of the following: (1) (Omitted) (2) A five-month moving average.(3) Exponential smoothing with a smoothing constant equal to .20, assuming a March forecast of 16(000).(4) The naive approach (5) A weighted average using .60 for August, .10 for July, and .30 for June.
 Problem 2: Forecasting (10 points) Given these sales figures over the last 6 weeks, your boss needs you to test two different forecasting methods (parts a and b below) to determine which method is best. For your measure of "best", recommend to your boss that the company should use the method with the lowest mean absolute deviation (MAD). Then use that method to provide your forecast for week 7 in part c. Week >WN Unit Sold 523 587 622 601...
 Problem 2: Forecasting (10 points) Given these sales figures over the last 6 weeks, your boss needs you to test two different forecasting methods (parts a and b below) to determine which method is best. For your measure of "best", recommend to your boss that the company should use the method with the lowest mean absolute deviation (MAD). Then use that method to provide your forecast for week 7 in part c. Week UWN Unit Sold 523 587 622 601...
 Problem 3-2 National Scan, Inc., sells radlo frequency Inventory tags. Monthly sales for a seven-month period were as follows: Sales Month(ee)Units Feb Mar Apr May Jun Jul Aug 2e 23 25 18 28 30 b. Forecast September sales volume using each of the folloWng: (1 A linear trend equation.(Round your Intermedlate calculatlons and final answer to 2 declmal places.) Yt thousands (2) A five-month moVing average. (Round your answer to 2 declmal places.) Moving averagehousands (3) Exponentlal smoothing with a...
 Need some help with this operations management question. It'd
also be nice if you could explain how you got your answer. Thanks.
National Scan, Inc., sells radio frequency inventory tags. Monthly sales for a seven-month period were as follows: Month Feb Mar Sales (000)Units 16 15 12 May Jun Jul Aug 19 23 25 b. Forecast September sales volume using each of the following (1) A linear trend equation. (Round your intermediate calculations and final answer to 2 decimal places.)...
Need some help with this operations management question. It'd
also be nice if you could explain how you got your answer. Thanks.
National Scan, Inc., sells radio frequency inventory tags. Monthly sales for a seven-month period were as follows: Month Feb Mar Sales (000)Units 16 15 12 May Jun Jul Aug 19 23 25 b. Forecast September sales volume using each of the following (1) A linear trend equation. (Round your intermediate calculations and final answer to 2 decimal places.)...
Most questions answered within 3 hours.
-
2) You are given the task of finding a representation for a
circle in a drawing...
asked 58 minutes ago -
STUDY QUESTION: Does use of diet drug fen-phen
(fenfluramine-phentermine) cause valvular heart disease?
HINT: Valvular heart...
asked 49 minutes ago -
1. An object weighing 40 N rests on a surface. The coefficient
of friction is 0.35....
asked 2 hours ago -
Investor company owns 35% of investee company voting stock and
accounts for the investment under the...
asked 3 hours ago -
The number of major faults on a randomly chosen 1 km stretch of
highway has a...
asked 3 hours ago -
Consider the competitive environment of Starbuck's, Progressive
Insurance, a manufacturing firm with low turnover, or a...
asked 4 hours ago -
3. Gains from trade
Consider two neighbouring island countries called Euphoria and
Contente. They each have...
asked 6 hours ago -
A business executive has the option to invest money in two
plans: Plan A guarantees that...
asked 8 hours ago -
Hello, can someone please help me answer this question?
How much heat is absorbed by a...
asked 8 hours ago -
. A marketing researcher conducted a survey of 25 shoppers
randomly selected at the local mall...
asked 8 hours ago -
Create an comprehensive response to the
following:
Antimicrobial agents work on a multitude of microbes (bacteria,...
asked 8 hours ago -
6.13 LAB: Step counter. Section 6.3.
A pedometer treats walking 2,000 steps as walking 1 mile....
asked 8 hours ago