
Homework Answers
Solution:-
a)
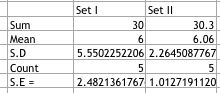
For Set I
State the hypotheses. The first step is to state the null hypothesis and an alternative hypothesis.
Null hypothesis: u = 10
Alternative hypothesis: u 10
Note that these hypotheses constitute a two-tailed test. The null hypothesis will be rejected if the sample mean is too big or if it is too small.
Formulate an analysis plan. For this analysis, the significance level is 0.05. The test method is a one-sample t-test.
Analyze sample data. Using sample data, we compute the standard error (SE), degrees of freedom (DF), and the t statistic test statistic (t).
SE = s / sqrt(n)
S.E = 2.4821
DF = n - 1
D.F = 4
t = (x - u) / SE
t = -1.61
where s is the standard deviation of the sample, x is the sample mean, u is the hypothesized population mean, and n is the sample size.
Since we have a two-tailed test, the P-value is the probability that the t statistic having 4 degrees of freedom is less than -1.61 or greater than 1.61.
Thus, the P-value = 0.183.
Interpret results. Since the P-value (0.183) is greater than the significance level (0.05), we cannot reject the null hypothesis.
For Set II
State the hypotheses. The first step is to state the null hypothesis and an alternative hypothesis.
Null hypothesis: u = 10
Alternative hypothesis: u 10
Note that these hypotheses constitute a two-tailed test. The null hypothesis will be rejected if the sample mean is too big or if it is too small.
Formulate an analysis plan. For this analysis, the significance level is 0.05. The test method is a one-sample t-test.
Analyze sample data. Using sample data, we compute the standard error (SE), degrees of freedom (DF), and the t statistic test statistic (t).
SE = s / sqrt(n)
S.E = 1.0127
DF = n - 1
D.F = 4
t = (x - u) / SE
t = - 3.89
where s is the standard deviation of the sample, x is the sample mean, u is the hypothesized population mean, and n is the sample size.
Since we have a two-tailed test, the P-value is the probability that the t statistic having 4 degrees of freedom is less than -3.89 or greater than 3.89.
Thus, the P-value = 0.018
Interpret results. Since the P-value (0.018) is less than the significance level (0.05), we have to reject the null hypothesis.
b) Yes the conclusions of the tests are reasonable.
Add Answer to:
The following two sample data sets both have sample mean 6. Set I 13.4 3.7 0.8...
Please solve it correctly I post this question before but I’m not sure about the solution...
 Please solve it correctly I post this question before but I’m
not sure about the solution that I got . the sample mean here is ((
6 )) for both sample sets
The following two sample data sets both have sample mean 6 Set I 13.4 3.7 0.8 10.3 1.8 Set II 2.6 8.2 5.2 7.2 6.8 (a) If μ is the population mean perform t-tests for each set to test Ho : μ 10 against 14: μ #10. Use...
Please solve it correctly I post this question before but I’m
not sure about the solution that I got . the sample mean here is ((
6 )) for both sample sets
The following two sample data sets both have sample mean 6 Set I 13.4 3.7 0.8 10.3 1.8 Set II 2.6 8.2 5.2 7.2 6.8 (a) If μ is the population mean perform t-tests for each set to test Ho : μ 10 against 14: μ #10. Use...
Please read what I write first this is the third time I post this question I...
 Please read what I write first
this is the third time I post this question I want a correct answer
. If you don’t know how to solve it then do not solve it there are
others experts can solve it . I post this question yesterday for a
second time and someone just copy and peast I wrong answer from the
first time I post this question .
**** HERE the sample mean is ((Equal)) to six for Both...
Please read what I write first
this is the third time I post this question I want a correct answer
. If you don’t know how to solve it then do not solve it there are
others experts can solve it . I post this question yesterday for a
second time and someone just copy and peast I wrong answer from the
first time I post this question .
**** HERE the sample mean is ((Equal)) to six for Both...
If you have two data sets with the following information. Both data have a mean of...
If you have two data sets with the following information. Both data have a mean of 100. In Data set one: The 25th quartile 50, the 50th is 100, and the 75th is 150. Data set two: The 25th quartile 75, the 50th is 100, and the 75th is 300. Which data set is more symmetric and why do you think that?
The data on the below shows the number of hours a particular drug is in the...
The data on the below shows the number of hours a particular drug is in the system of 200 females. Develop a histogram of this data according to the following intervals: Follow the directions. Test the hypothesis that these data are distributed exponentially. Determine the test statistic. Round to two decimal places. (sort the data first) [0, 3) [3, 6) [6, 9) [9, 12) [12, 18) [18, 24) [24, infinity) 34.7 11.8 10 7.8 2.8 20 9.8 20.4 1.2 7.2...
Consider the following two sample data sets. Set 1: 6 39 8 7 0 Set 2:...
 Consider the following two sample data sets. Set 1: 6 39 8 7 0 Set 2: 2 16 18 7 4 a. Calculate the coefficient of variation for each data set. b. Which data set has more variability? a. The coefficient of variation for set 1 is %. (Round to one decimal place as needed.)
In the picture below, I have the output for the same two sets of data. I ran the hypothesis test and the confidence interval. If you had a choice to use one output or the other, which would you choose...
In the picture below, I have the output for the same two sets of data. I ran the hypothesis test and the confidence interval. If you had a choice to use one output or the other, which would you choose and why? Make sure to be specific and include what information you get from each and what information you don't get if you use one over the other. Options Two sample T summary hypothesis test: : Mean of Population 1...
Each of the following three data sets represents the 1Q scores of a random sample For...
 Each of the following three data sets represents the 1Q scores of a random sample For each data set, compute the mean and median. of adults. IQ scores are known to have a mean and median of 100. What is the mean of the sample of size 5? Full data set Sample of Size 5 104 108 105 91 Type an integer or decimal rounded to one decimal place as needed.) What is the mean of the sample of size...
Assume that you have a sample of n 1-7, with the sample mean X1-43, and a...
 Assume that you have a sample of n 1-7, with the sample mean X1-43, and a sample standard deviation of S1-4, and you have an independent sample of n2-13 from another population with a sample mean of x2 39 and the sample standard deviation S2-7. Complete parts (a) through (d). Click here for page 1 of critical values oft. Click here for page 2 of critical values of t. a. What is the value of the pooled-variance ISTAT test statistic...
If I run an ANOVA on a two-sample data set, and get F(1, 12) = 4.56,...
If I run an ANOVA on a two-sample data set, and get F(1, 12) = 4.56, what would be the corresponding t-value if I would have just used a t-test? How do you know? What is the corresponding p -value? Would you consider this result statistically significant?
Saved 2023 A sample of 100 bank customer waiting times are given in the following table:...
 Saved 2023 A sample of 100 bank customer waiting times are given in the following table: Waiting Times (in Minutes) for the Bank Custoner Waiting Tine Case 4.5 9.7 11.8 10.4 4.2 7.e 5.5 8.7 8.8 5.1 5.4 4.5 6.2 3.9 8.7 7.6 4.7 4.0 4.0 10.1 .3 2.8 5.4 6.5 9.7 5.2 7.0 5.8 4.5 8.2 1.9 5.2 4.1 7.9 5.3 8.8 6.2 4.1 4.1 4.5 10.4 .2 7.0 6.8 5.5 8.3 11.3 5.9 8.8 2.8 6.7 5.5 5.e...
 Please solve it correctly I post this question before but I’m
not sure about the solution that I got . the sample mean here is ((
6 )) for both sample sets
The following two sample data sets both have sample mean 6 Set I 13.4 3.7 0.8 10.3 1.8 Set II 2.6 8.2 5.2 7.2 6.8 (a) If μ is the population mean perform t-tests for each set to test Ho : μ 10 against 14: μ #10. Use...
Please solve it correctly I post this question before but I’m
not sure about the solution that I got . the sample mean here is ((
6 )) for both sample sets
The following two sample data sets both have sample mean 6 Set I 13.4 3.7 0.8 10.3 1.8 Set II 2.6 8.2 5.2 7.2 6.8 (a) If μ is the population mean perform t-tests for each set to test Ho : μ 10 against 14: μ #10. Use...
 Please read what I write first
this is the third time I post this question I want a correct answer
. If you don’t know how to solve it then do not solve it there are
others experts can solve it . I post this question yesterday for a
second time and someone just copy and peast I wrong answer from the
first time I post this question .
**** HERE the sample mean is ((Equal)) to six for Both...
Please read what I write first
this is the third time I post this question I want a correct answer
. If you don’t know how to solve it then do not solve it there are
others experts can solve it . I post this question yesterday for a
second time and someone just copy and peast I wrong answer from the
first time I post this question .
**** HERE the sample mean is ((Equal)) to six for Both...
 Consider the following two sample data sets. Set 1: 6 39 8 7 0 Set 2: 2 16 18 7 4 a. Calculate the coefficient of variation for each data set. b. Which data set has more variability? a. The coefficient of variation for set 1 is %. (Round to one decimal place as needed.)
 Each of the following three data sets represents the 1Q scores of a random sample For each data set, compute the mean and median. of adults. IQ scores are known to have a mean and median of 100. What is the mean of the sample of size 5? Full data set Sample of Size 5 104 108 105 91 Type an integer or decimal rounded to one decimal place as needed.) What is the mean of the sample of size...
 Assume that you have a sample of n 1-7, with the sample mean X1-43, and a sample standard deviation of S1-4, and you have an independent sample of n2-13 from another population with a sample mean of x2 39 and the sample standard deviation S2-7. Complete parts (a) through (d). Click here for page 1 of critical values oft. Click here for page 2 of critical values of t. a. What is the value of the pooled-variance ISTAT test statistic...
 Saved 2023 A sample of 100 bank customer waiting times are given in the following table: Waiting Times (in Minutes) for the Bank Custoner Waiting Tine Case 4.5 9.7 11.8 10.4 4.2 7.e 5.5 8.7 8.8 5.1 5.4 4.5 6.2 3.9 8.7 7.6 4.7 4.0 4.0 10.1 .3 2.8 5.4 6.5 9.7 5.2 7.0 5.8 4.5 8.2 1.9 5.2 4.1 7.9 5.3 8.8 6.2 4.1 4.1 4.5 10.4 .2 7.0 6.8 5.5 8.3 11.3 5.9 8.8 2.8 6.7 5.5 5.e...
Most questions answered within 3 hours.
-
Given the following information:
acetic acid
CH3COOH
Ka = 1.8×10⁻⁵
triethylamine
(C2H5)3N
Kb = 5.2×10⁻⁴
(1)...
asked 5 minutes ago -
Potassium permanganate(KMNO4)is has a solubility of 6.4 g/ 100 g
of water at 20ºC, and 250...
asked 2 minutes ago -
51.
As the marginal propensity to expend rises, the multiplier:
decreases.
is impossible to determine.
increases....
asked 9 minutes ago -
The Baldwin Company currently has the following balances on their
balance sheet:
Total
Liabilities
$69,309
Common...
asked 12 minutes ago -
A quiet town in Kansas has 10 people, all of whom have the same
preferences. There...
asked 17 minutes ago -
Summarize what an organization needs from a leader.
a. Analyze what might happen to an organization...
asked 20 minutes ago -
How would one critically evaluate an organizations marketing
strategies from the viewpoint of its consumers, as...
asked 19 minutes ago -
Given a standardized normal distribution (with μ = 0 and a σ =
1), what is...
asked 19 minutes ago -
Company XYZ know that replacement times for the quartz time
pieces it produces are normally distributed...
asked 34 minutes ago -
A) Write the acid-base reaction that occurs between Na2HPO4 and
NaOH
B) Write the possible reactions...
asked 48 minutes ago -
What advantages does the Natural Law Theory have in comparison
with the Divine Command Theory? Explain...
asked 54 minutes ago -
A diver comes off a board with arms straight up and legs
straight down, giving her...
asked 53 minutes ago