The investigators administered the study questionnaire by telephone from March 15-23. Students selected for participation were called at their dormitory room or their home telephone number as recorded in university records. If the student was not present at either location but information on his/her whereabouts was available, additional phone calls were made to contact the student. Students not reached during spring break were interviewed on their return to the university.
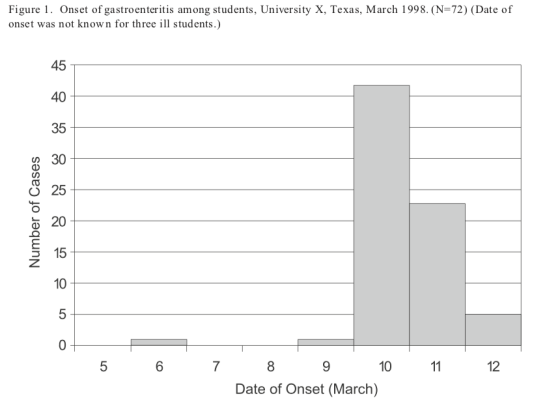
Thirty-six cases and 144 controls were contacted. Cases included in the study were similar to all cases with respect to gender, age, and year in college. Their dates of onset of illness had a distribution similar to that seen in Figure 1.
Results from the unmatched case-control study were tabulated by TDH and CDC epidemiologists. Only persons who ate at the main cafeteria for the specified period were included in the meal-specific analyses. (Table 2)
Table 2. Risk factors for illness among persons eating at the main cafeteria, unmatched case-control study, University X, Texas, March 9-10, 1998.
|
Exposure |
Ill exposed/ Total ill |
Well exposed/ Total well |
Measure of association |
p-value |
|
Ate at salad bar - lunch March 9 |
9/30 |
36/100 |
||
|
Ate at salad bar - dinner March 9 |
5/18 |
15/59 |
||
|
Ate at salad bar - lunch March 10 |
6/28 |
23/96 |
||
|
Ate at salad bar - dinner March 10 |
6/15 |
12/44 |
||
|
Ate at salad bar* |
13/19 |
49/69 |
||
|
Ate at deli bar - lunch March 9 |
18/30 |
12/101 |
||
|
Ate at deli bar - dinner March 9 |
7/18 |
5/61 |
||
|
Ate at deli bar - lunch March 10 |
13/29 |
12/96 |
||
|
Ate at deli bar - dinner March 10 |
4/16 |
4/44 |
||
|
Ate at deli bar* |
28/36 |
20/116 |
Question 20: Calculate the appropriate measure of association for these exposures. Interpret the results.
HI! What is the formula for measuring association?
Homework Answers
Hi,
In this question ,we will calculating risk ratio as the measure of association. Risk ratio is defined as, in this case, the ratio of attack ratios of those who are ill and those who are well.
Attack ratio is given as:
a. For ill, attack ratioill= Number of ill people exposed/Total number of ill people
b. For well people, attack ratiowell= Number of well people exposed/Total number of well people
Risk ratio = attack ratioill/attack ratiowell
| Exposure | Ill exposed/ Total ill | Well exposed/ Total well | Measure of association |
| Ate at salad bar - lunch March 9 | 0.30 | 0.36 | 0.833 |
| Ate at salad bar - dinner March 9 | 0.28 | 0.25 | 1.093 |
| Ate at salad bar - lunch March 10 | 0.21 | 0.24 | 0.894 |
| Ate at salad bar - dinner March 10 | 0.40 | 0.27 | 1.467 |
| Ate at salad bar* | 0.68 | 0.71 | 0.963 |
| Ate at deli bar - lunch March 9 | 0.60 | 0.12 | 5.050 |
| Ate at deli bar - dinner March 9 | 0.39 | 0.08 | 4.744 |
| Ate at deli bar - lunch March 10 | 0.45 | 0.13 | 3.586 |
| Ate at deli bar - dinner March 10 | 0.25 | 0.09 | 2.750 |
| Ate at deli bar* | 0.78 | 0.09 | 9.022 |
Add Answer to:
The investigators administered the study questionnaire by telephone from March 15-23. Students selected for participation were...
The investigators administered the study questionnaire by telephone from March 15-23. Students selected for participation were...
The investigators administered the study questionnaire by telephone from March 15-23. Students selected for participation were called at their dormitory room or their home telephone number as recorded in university records. If the student was not present at either location but information on his/her whereabouts was available, additional phone calls were made to contact the student. Students not reached during spring break were interviewed on their return to the university. Thirty-six cases and 144 controls were contacted. Cases included in...
please answer questions 6-9 Later that afternoon, preliminary culture results from 17 ill students became available....
 please answer questions 6-9
Later that afternoon, preliminary culture results from 17 ill students became available. The specimens, collected primarily from the emergency room at Hospital A on March 10, did not identify Salmonella, Shigella, Campylobacter, Vibrio, Listeria, Yersinia, Escherichia coli O157:H7, Bacillus cerns, or Staphylococcus aures. Some specimens were positive for fecal leukocytes and fecal occult blood. Question 6 How might you interpret the bacterial culture results? What questions do these results raiso? DESCRIPTIVE EPIDEMIOLOGY AND HYPOTHESIS GENERATION By...
please answer questions 6-9
Later that afternoon, preliminary culture results from 17 ill students became available. The specimens, collected primarily from the emergency room at Hospital A on March 10, did not identify Salmonella, Shigella, Campylobacter, Vibrio, Listeria, Yersinia, Escherichia coli O157:H7, Bacillus cerns, or Staphylococcus aures. Some specimens were positive for fecal leukocytes and fecal occult blood. Question 6 How might you interpret the bacterial culture results? What questions do these results raiso? DESCRIPTIVE EPIDEMIOLOGY AND HYPOTHESIS GENERATION By...
Over 1,700 patients with lung cancer, all under age 75, were eligible for the case-control study. About 15% of these per...
Over 1,700 patients with lung cancer, all under age 75, were eligible for the case-control study. About 15% of these persons were not interviewed because of death, discharge, severity of illness, or inability to speak English. An additional group of patients were interviewed but later excluded when initial lung cancer diagnosis proved mistaken. The final study group included 1,465 cases (1,357 males and 108 females). The following table shows the relationship between cigarette smoking and lung cancer among male cases...
Lung Cancer & Smoking Case Study A causal relationship between cigarette smoking and lung cancer was...
 Lung Cancer & Smoking Case Study A causal relationship between cigarette smoking and lung cancer was first suspected in the 1920s on the basis of clinical observations. To test this apparent association, numerous epidemiologic studies were undertaken between 1930 and 1960. Two studies were conducted by Richard Doll and Austin Bradford Hill in Great Britain The first was a case-control study begun in 1947 comparing the smoking habits of lung cancer patients with the smoking habits of other patients. The...
QUESTION 1 Working conditions during the Industrial Revolution were deplorable for many types of employees. True...
QUESTION 1 Working conditions during the Industrial Revolution were deplorable for many types of employees. True False 2 points QUESTION 2 The General Duty Clause requires provision of a place of employment free from recognized hazards True False 2 points QUESTION 3 In a case-control study, cases are those who have the outcome of interest and the controls are those who do not. True False 2 points QUESTION 4 Alpha particles are particulate energy and not electromagnetic...
Can anyone help me with this nutrition homework? How many Calories did Bobby consume (note that...
 Can anyone help me with this nutrition homework?
How many Calories did Bobby consume (note that digestible
carbohydrate includes sugar grams)?
A. 2030 B. 2550 C. 2887 D. 2982 E. 3525
Based upon Bobby's Calorie intake, Bobby's Dietary Reference
Intake (DRI) for fiber is _____ grams.
A. 25 B. 38 C. 40.4 D. 42 E. 54.5
Bobby consumed _____ percent of his Calories from sugar, and
_____ the AMDR.
4.4, met
10,met
13,met
26, did not meet
32,didnotmeet
Bobby consumed...
Can anyone help me with this nutrition homework?
How many Calories did Bobby consume (note that digestible
carbohydrate includes sugar grams)?
A. 2030 B. 2550 C. 2887 D. 2982 E. 3525
Based upon Bobby's Calorie intake, Bobby's Dietary Reference
Intake (DRI) for fiber is _____ grams.
A. 25 B. 38 C. 40.4 D. 42 E. 54.5
Bobby consumed _____ percent of his Calories from sugar, and
_____ the AMDR.
4.4, met
10,met
13,met
26, did not meet
32,didnotmeet
Bobby consumed...
CASE 20 Enron: Not Accounting for the Future* INTRODUCTION Once upon a time, there was a...
 CASE 20 Enron: Not Accounting for the Future* INTRODUCTION Once upon a time, there was a gleaming office tower in Houston, Texas. In front of that gleaming tower was a giant "E" slowly revolving, flashing in the hot Texas sun. But in 2001, the Enron Corporation, which once ranked among the top Fortune 500 companies, would collapse under a mountain of debt that had been concealed through a complex scheme of off-balance-sheet partnerships. Forced to declare bankruptcy, the energy firm...
Case: Enron: Questionable Accounting Leads to CollapseIntroductionOnce upon a time, there was a gleaming...
Case: Enron: Questionable Accounting Leads to CollapseIntroductionOnce upon a time, there was a gleaming office tower in Houston, Texas. In front of that gleaming tower was a giant “E,” slowly revolving, flashing in the hot Texas sun. But in 2001, the Enron Corporation, which once ranked among the top Fortune 500 companies, would collapse under a mountain of debt that had been concealed through a complex scheme of off-balance-sheet partnerships. Forced to declare bankruptcy, the energy firm laid off 4,000...
 please answer questions 6-9
Later that afternoon, preliminary culture results from 17 ill students became available. The specimens, collected primarily from the emergency room at Hospital A on March 10, did not identify Salmonella, Shigella, Campylobacter, Vibrio, Listeria, Yersinia, Escherichia coli O157:H7, Bacillus cerns, or Staphylococcus aures. Some specimens were positive for fecal leukocytes and fecal occult blood. Question 6 How might you interpret the bacterial culture results? What questions do these results raiso? DESCRIPTIVE EPIDEMIOLOGY AND HYPOTHESIS GENERATION By...
please answer questions 6-9
Later that afternoon, preliminary culture results from 17 ill students became available. The specimens, collected primarily from the emergency room at Hospital A on March 10, did not identify Salmonella, Shigella, Campylobacter, Vibrio, Listeria, Yersinia, Escherichia coli O157:H7, Bacillus cerns, or Staphylococcus aures. Some specimens were positive for fecal leukocytes and fecal occult blood. Question 6 How might you interpret the bacterial culture results? What questions do these results raiso? DESCRIPTIVE EPIDEMIOLOGY AND HYPOTHESIS GENERATION By...
 Lung Cancer & Smoking Case Study A causal relationship between cigarette smoking and lung cancer was first suspected in the 1920s on the basis of clinical observations. To test this apparent association, numerous epidemiologic studies were undertaken between 1930 and 1960. Two studies were conducted by Richard Doll and Austin Bradford Hill in Great Britain The first was a case-control study begun in 1947 comparing the smoking habits of lung cancer patients with the smoking habits of other patients. The...
 Can anyone help me with this nutrition homework?
How many Calories did Bobby consume (note that digestible
carbohydrate includes sugar grams)?
A. 2030 B. 2550 C. 2887 D. 2982 E. 3525
Based upon Bobby's Calorie intake, Bobby's Dietary Reference
Intake (DRI) for fiber is _____ grams.
A. 25 B. 38 C. 40.4 D. 42 E. 54.5
Bobby consumed _____ percent of his Calories from sugar, and
_____ the AMDR.
4.4, met
10,met
13,met
26, did not meet
32,didnotmeet
Bobby consumed...
Can anyone help me with this nutrition homework?
How many Calories did Bobby consume (note that digestible
carbohydrate includes sugar grams)?
A. 2030 B. 2550 C. 2887 D. 2982 E. 3525
Based upon Bobby's Calorie intake, Bobby's Dietary Reference
Intake (DRI) for fiber is _____ grams.
A. 25 B. 38 C. 40.4 D. 42 E. 54.5
Bobby consumed _____ percent of his Calories from sugar, and
_____ the AMDR.
4.4, met
10,met
13,met
26, did not meet
32,didnotmeet
Bobby consumed...
 CASE 20 Enron: Not Accounting for the Future* INTRODUCTION Once upon a time, there was a gleaming office tower in Houston, Texas. In front of that gleaming tower was a giant "E" slowly revolving, flashing in the hot Texas sun. But in 2001, the Enron Corporation, which once ranked among the top Fortune 500 companies, would collapse under a mountain of debt that had been concealed through a complex scheme of off-balance-sheet partnerships. Forced to declare bankruptcy, the energy firm...
Most questions answered within 3 hours.
-
Topic: Cloud computing in UAE
1. Introduction of cloud computing (100
words)
2. Benefits of cloud...
asked 2 minutes ago -
Prove that A is Turing-recognizable if and only if A
≤m ATM.
asked 3 minutes ago -
A company has an enterprise value of $20mm. It has debt
outstanding of $4mm. It has...
asked 14 minutes ago -
Which of the following ion pairs are the spectator ions in the
following reaction:
Pb(C2H3O2)2
+...
asked 13 minutes ago -
Perine, Inc., has balance sheet equity of $6.2 million. At the
same time, the income statement...
asked 20 minutes ago -
Fixed, or sunk costs, will NOT factor into which of the
following?
average cost determination
profitability...
asked 42 minutes ago -
Identify the major anatomical components of the
cardiovascular and respiratory systems and explain their
functions.
asked 44 minutes ago -
A
grocery stores receipts show that Sunday customers purchases have a
skewed distribution with a mean...
asked 48 minutes ago -
(Covered Interest Arbitrage) Harry Norman, a foreign exchange
trader at UBS’s office in Tokyo has $2,000,000...
asked 57 minutes ago -
The structure of an advertising campaign is:
a.the process of preparing and integrating a
specific...
asked 56 minutes ago -
Suppose the lengths of human pregnancies are normally
distributed with
muμequals=266
days and
sigmaσequals=16
days. Complete...
asked 1 hour ago -
a sample of the labor costs per hour to assemble a product has a
mean of...
asked 1 hour ago