

PLEASE TYPE ANSWERS. DO NOT WRITE ! IT SHOULD LOOK
SIMILAR TO THIS (SEE IMAGE BELOW):
Homework Answers
Solution
(a)
|
2006 |
2005 |
|||||
|
i. Gross Margin Percentage = |
Gross Margin X 100 |
840 * 100 |
40 |
710 * 100 |
37.37 |
|
|
Sales |
2100 |
1900 |
||||
|
ii. Net Income Percentage = |
Net Income X 100 |
105 * 100 |
5 |
85 * 100 |
4.47 |
|
|
Sales |
2100 |
1900 |
||||
|
iii. Current Ratio = |
Current Assets |
490 |
2.45 |
511 |
1.76 |
|
|
Current Liabilities |
200 |
290 |
||||
|
iv. Acid Test Ratio = |
Current Assets - Inventories |
490 - 300 |
0.95 |
511 - 315 |
0.68 |
|
|
Current Liabilities |
200 |
290 |
||||
|
v. Inventory Turnover Ratio = |
Cost of Goods Sold |
1260 |
4.38 |
1190 |
3.87 |
|
|
Average Inventory |
287.5 |
307.5 |
||||
|
Average Inventory = |
Opening Inventory + Closing Inventory |
260 + 315 |
287.5 |
315 + 300 |
307.5 |
|
|
2 |
2 |
2 |
||||
|
vi. Debt to Equity Ratio = |
Total Debt |
300 |
0.375 |
275 |
0.426 |
|
|
Shareholders’ Equity |
800 |
646 |
||||
|
vii. Interest Coverage Ratio = |
Net Operating Income |
180 |
6 |
200 |
3.33 |
|
|
Interest Expenses |
30 |
60 |
(b)
Liquidity: It is a measure of business’s ability to use current assets to cover current liabilities. It can be clearly seen that the business has gained more liquidity than previous year.
Profitability: It is a measure of business's efficiency by showing its overall return by utilizing its resources. It can be clearly seen that as the business has gained more than previous year, it has become more efficient than previous year.
Add Answer to:
PLEASE TYPE ANSWERS. DO NOT WRITE ! IT SHOULD LOOK SIMILAR TO THIS (SEE IMAGE BELOW):...
DO NOT WRITE ANSWERS !! PLEASE TYPE ANSWERS SO THEY CAN LOOK SIMILAR TO THIS :...
 DO NOT WRITE ANSWERS !! PLEASE TYPE ANSWERS SO THEY CAN
LOOK SIMILAR TO THIS :
AGAIN PLEASE TYPE ANSWERS SO THEY CAN LOOK SIMILAR TO
THE ABOVE PHOTO !!
Balance Sheet for the period ending June 30 Assets 2006 2005 Current assets $21,000 $160,000 $300,000 $24,000 $162,000 $315,000 Cash Accounts receivables Inventories $9,000 $490,000 $810,000 $10,000 $511,000 Prepaid expenses Total current assets $700,000 $1,211,000 Property and equipment $1,300,000 Total assets Liabilities and shareholders equity Liabilities $200,000 $290,000 Current liabilities...
DO NOT WRITE ANSWERS !! PLEASE TYPE ANSWERS SO THEY CAN
LOOK SIMILAR TO THIS :
AGAIN PLEASE TYPE ANSWERS SO THEY CAN LOOK SIMILAR TO
THE ABOVE PHOTO !!
Balance Sheet for the period ending June 30 Assets 2006 2005 Current assets $21,000 $160,000 $300,000 $24,000 $162,000 $315,000 Cash Accounts receivables Inventories $9,000 $490,000 $810,000 $10,000 $511,000 Prepaid expenses Total current assets $700,000 $1,211,000 Property and equipment $1,300,000 Total assets Liabilities and shareholders equity Liabilities $200,000 $290,000 Current liabilities...
PLEASE TYPE THIS ON A COMPUTER SO IT CAN BE NEAT LIKE THE IMAGE BELOW !!...
 PLEASE TYPE THIS ON A COMPUTER SO
IT CAN BE NEAT LIKE THE IMAGE BELOW !! PLEASE DO NOT WRITE. TYPE
THE ANSWER SO IT CAN BE SIMILAR TO THIS :
2006 2005 Balance Sheet for the period ending June 30 Assets Current assets Cash Accounts receivables Inventories Prepaid expenses Total current assets Property and equipment Total assets $21,000 $160,000 $300,000 $9,000 $490,000 $810,000 $1,300,000 $24,000 $162,000 $315,000 $10,000 $511,000 $700,000 $1,211,000 Liabilities and shareholders equity Liabilities Current liabilities 10%...
PLEASE TYPE THIS ON A COMPUTER SO
IT CAN BE NEAT LIKE THE IMAGE BELOW !! PLEASE DO NOT WRITE. TYPE
THE ANSWER SO IT CAN BE SIMILAR TO THIS :
2006 2005 Balance Sheet for the period ending June 30 Assets Current assets Cash Accounts receivables Inventories Prepaid expenses Total current assets Property and equipment Total assets $21,000 $160,000 $300,000 $9,000 $490,000 $810,000 $1,300,000 $24,000 $162,000 $315,000 $10,000 $511,000 $700,000 $1,211,000 Liabilities and shareholders equity Liabilities Current liabilities 10%...
RATIO ANALYSIS PLEASE ANSWER THIS USING A COMPUTER , TYPE ANSWERS ON A COMPUTER !! DO...
 RATIO ANALYSIS
PLEASE ANSWER THIS USING A COMPUTER , TYPE ANSWERS ON A
COMPUTER !! DO NOT WRITE !! I WOULD LIKE ANSWERS TO LOOK SIMILAR TO
THIS LAYOUT :
2006 2005 Balance Sheet for the period ending June 30 Assets Current assets Cash Accounts receivables Inventories Prepaid expenses Total current assets Property and equipment Total assets $21,000 $160,000 $300,000 $9,000 $490,000 $810,000 $1,300,000 $24,000 $162,000 $315,000 $10,000 $511,000 $700,000 $1,211,000 Liabilities and shareholders equity Liabilities Current liabilities 10% bonds...
RATIO ANALYSIS
PLEASE ANSWER THIS USING A COMPUTER , TYPE ANSWERS ON A
COMPUTER !! DO NOT WRITE !! I WOULD LIKE ANSWERS TO LOOK SIMILAR TO
THIS LAYOUT :
2006 2005 Balance Sheet for the period ending June 30 Assets Current assets Cash Accounts receivables Inventories Prepaid expenses Total current assets Property and equipment Total assets $21,000 $160,000 $300,000 $9,000 $490,000 $810,000 $1,300,000 $24,000 $162,000 $315,000 $10,000 $511,000 $700,000 $1,211,000 Liabilities and shareholders equity Liabilities Current liabilities 10% bonds...
PLEASE DO THE ABOVE QUESTION SIMILAR TO THIS : Question 3 The recent financial statements for the Royal Caribbean Com...
 PLEASE DO THE ABOVE QUESTION SIMILAR TO THIS
:
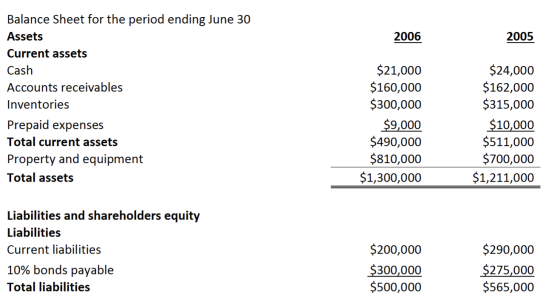
Question 3 The recent financial statements for the Royal Caribbean Company are given below: 2006 2005 Balance Sheet for the period ending June 30 Assets Current assets Cash Accounts receivables Inventories Prepaid expenses Total current assets Property and equipment Total assets $21,000 $160,000 $300,000 $9,000 $490,000 $810,000 $1,300,000 $24,000 $162,000 $315,000 $10,000 $511,000 $700,000 $1,211,000 Liabilities and shareholders equity Liabilities Current liabilities 10% bonds payable Total liabilities $200,000 $300,000 $500,000 $290,000...
PLEASE DO THE ABOVE QUESTION SIMILAR TO THIS
:
Question 3 The recent financial statements for the Royal Caribbean Company are given below: 2006 2005 Balance Sheet for the period ending June 30 Assets Current assets Cash Accounts receivables Inventories Prepaid expenses Total current assets Property and equipment Total assets $21,000 $160,000 $300,000 $9,000 $490,000 $810,000 $1,300,000 $24,000 $162,000 $315,000 $10,000 $511,000 $700,000 $1,211,000 Liabilities and shareholders equity Liabilities Current liabilities 10% bonds payable Total liabilities $200,000 $300,000 $500,000 $290,000...
Question 4 Daniel, an investor is considering purchasing shares in either Garth Ltd & James Ltd....
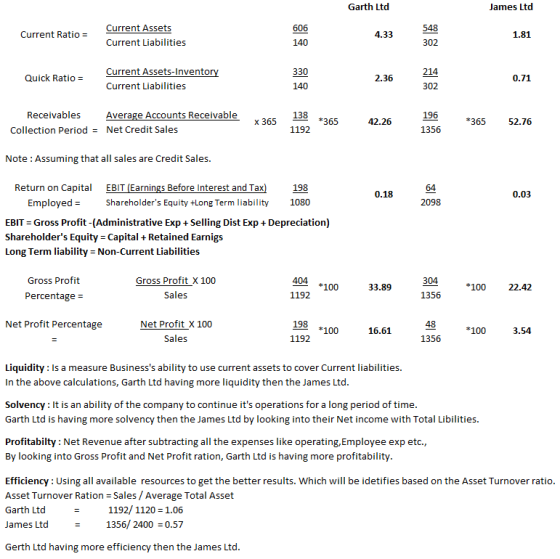
 Question 4 Daniel, an investor is considering purchasing shares in either Garth Ltd & James Ltd. Both companies are in the same line of business and their accounts are summarized below: Statement of financial Position as at December 1st 2016 Assets Garth Ltd James Ltd. Non Current Assets S'000 S'000 S'000 S'000 2 140 840 At Cost Accumulated Depreciation (226) 1 852 614 (280) Current Assets 276 334 Inventory Receivables 138 196 Bank and Cash 192 606 18 548 1...
Question 3 The recent financial statements for the Royal Caribbean Company are given below: 2006 2005 Balance Sheet for...
 Question 3 The recent financial statements for the Royal Caribbean Company are given below: 2006 2005 Balance Sheet for the period ending June 30 Assets Current assets Cash Accounts receivables Inventories Prepaid expenses Total current assets Property and equipment Total assets $21,000 $160,000 $300,000 $9,000 $490,000 $810,000 $1,300,000 $24,000 $162,000 $315,000 $10,000 $511,000 $700,000 $1,211,000 Liabilities and shareholders equity Liabilities Current liabilities 10% bonds payable Total liabilities $200,000 $300,000 $500,000 $290,000 $275,000 $565,000 Shareholders equity Common stock $5 per share...
1. Given the 2019 ratios of Verizon wireless what do EACH of these ratios indicate about...
1. Given the 2019 ratios of Verizon wireless what do EACH of these ratios indicate about the company specifically? (not just as a whole) 2. Lastly, at the end, in one paragraph what do these calculations (all together) mean for the companies financial health? Answers must be broken down into everyday language and not in "financial talk" Profit ratios: gross profit margin (gross profit / sales)*100 gross profit 77142000 sales 131868000 gross profit margin 58.50% operating profit margin (operating profit...
Calculate the ratios below given the financial data presented to your left. Answers Measures of Short-term...
 Calculate the ratios below given the financial data presented to your left. Answers Measures of Short-term Liquidity current assets / current liabilities quick assets / current liabilities net sales /accounts receivable 365 days/receivables turnover rate cost of goods sold/inventory current ratio quick ratico receivables turnover rate days to collect receivables inventory turnover rate Measures of Long-term Credit Risk total liabilities/total assets operating income /annual interest expense debt ratio Times Interest Earned Measures of Profitability net income / sales net income/total...
Kindly, correct me if I am wrong. Income statement (represents profitability in period of time) Sales...
 Kindly, correct me if I am
wrong.
Income statement (represents profitability in period of time) Sales (Revenue) Total sales Cost of goods sold (COGS) Gross profit SALES - COGS Depreciation (operational cost) (x) Selling & admin expenses (operational cost) Operating profit (net income) Gross profit - (X+Y) Interest expenses (interest) Earnings before Taxes Operating profit - interest Taxes (TAX) Earnings after Taxes EBT-TAX Ration Analysis Liquidity Ratio: ► Ability to meet short term immediate obligations ► Current Ratio (C.R) =...
Kindly, correct me if I am
wrong.
Income statement (represents profitability in period of time) Sales (Revenue) Total sales Cost of goods sold (COGS) Gross profit SALES - COGS Depreciation (operational cost) (x) Selling & admin expenses (operational cost) Operating profit (net income) Gross profit - (X+Y) Interest expenses (interest) Earnings before Taxes Operating profit - interest Taxes (TAX) Earnings after Taxes EBT-TAX Ration Analysis Liquidity Ratio: ► Ability to meet short term immediate obligations ► Current Ratio (C.R) =...
PROJECT: Select any bank / firm of your choice. Take out its financial statements. Calculate the...
 PROJECT:
Select any bank / firm of your choice. Take out its financial
statements.
Calculate the following ratios according to the information
found in these statements.
(NOTE: Show your workings)
1. Operating Cycle. Inventory Number of days of inventory - Average day's cost of goods sold Inventory cost of goods sold / 305 Number of days of receivables = Accounts receivable Average day's sales on credit Accounts receivable Sales on credit / 365 Number of days of payables - Accounts...
PROJECT:
Select any bank / firm of your choice. Take out its financial
statements.
Calculate the following ratios according to the information
found in these statements.
(NOTE: Show your workings)
1. Operating Cycle. Inventory Number of days of inventory - Average day's cost of goods sold Inventory cost of goods sold / 305 Number of days of receivables = Accounts receivable Average day's sales on credit Accounts receivable Sales on credit / 365 Number of days of payables - Accounts...
 DO NOT WRITE ANSWERS !! PLEASE TYPE ANSWERS SO THEY CAN
LOOK SIMILAR TO THIS :
AGAIN PLEASE TYPE ANSWERS SO THEY CAN LOOK SIMILAR TO
THE ABOVE PHOTO !!
Balance Sheet for the period ending June 30 Assets 2006 2005 Current assets $21,000 $160,000 $300,000 $24,000 $162,000 $315,000 Cash Accounts receivables Inventories $9,000 $490,000 $810,000 $10,000 $511,000 Prepaid expenses Total current assets $700,000 $1,211,000 Property and equipment $1,300,000 Total assets Liabilities and shareholders equity Liabilities $200,000 $290,000 Current liabilities...
DO NOT WRITE ANSWERS !! PLEASE TYPE ANSWERS SO THEY CAN
LOOK SIMILAR TO THIS :
AGAIN PLEASE TYPE ANSWERS SO THEY CAN LOOK SIMILAR TO
THE ABOVE PHOTO !!
Balance Sheet for the period ending June 30 Assets 2006 2005 Current assets $21,000 $160,000 $300,000 $24,000 $162,000 $315,000 Cash Accounts receivables Inventories $9,000 $490,000 $810,000 $10,000 $511,000 Prepaid expenses Total current assets $700,000 $1,211,000 Property and equipment $1,300,000 Total assets Liabilities and shareholders equity Liabilities $200,000 $290,000 Current liabilities...
 PLEASE TYPE THIS ON A COMPUTER SO
IT CAN BE NEAT LIKE THE IMAGE BELOW !! PLEASE DO NOT WRITE. TYPE
THE ANSWER SO IT CAN BE SIMILAR TO THIS :
2006 2005 Balance Sheet for the period ending June 30 Assets Current assets Cash Accounts receivables Inventories Prepaid expenses Total current assets Property and equipment Total assets $21,000 $160,000 $300,000 $9,000 $490,000 $810,000 $1,300,000 $24,000 $162,000 $315,000 $10,000 $511,000 $700,000 $1,211,000 Liabilities and shareholders equity Liabilities Current liabilities 10%...
PLEASE TYPE THIS ON A COMPUTER SO
IT CAN BE NEAT LIKE THE IMAGE BELOW !! PLEASE DO NOT WRITE. TYPE
THE ANSWER SO IT CAN BE SIMILAR TO THIS :
2006 2005 Balance Sheet for the period ending June 30 Assets Current assets Cash Accounts receivables Inventories Prepaid expenses Total current assets Property and equipment Total assets $21,000 $160,000 $300,000 $9,000 $490,000 $810,000 $1,300,000 $24,000 $162,000 $315,000 $10,000 $511,000 $700,000 $1,211,000 Liabilities and shareholders equity Liabilities Current liabilities 10%...
 RATIO ANALYSIS
PLEASE ANSWER THIS USING A COMPUTER , TYPE ANSWERS ON A
COMPUTER !! DO NOT WRITE !! I WOULD LIKE ANSWERS TO LOOK SIMILAR TO
THIS LAYOUT :
2006 2005 Balance Sheet for the period ending June 30 Assets Current assets Cash Accounts receivables Inventories Prepaid expenses Total current assets Property and equipment Total assets $21,000 $160,000 $300,000 $9,000 $490,000 $810,000 $1,300,000 $24,000 $162,000 $315,000 $10,000 $511,000 $700,000 $1,211,000 Liabilities and shareholders equity Liabilities Current liabilities 10% bonds...
RATIO ANALYSIS
PLEASE ANSWER THIS USING A COMPUTER , TYPE ANSWERS ON A
COMPUTER !! DO NOT WRITE !! I WOULD LIKE ANSWERS TO LOOK SIMILAR TO
THIS LAYOUT :
2006 2005 Balance Sheet for the period ending June 30 Assets Current assets Cash Accounts receivables Inventories Prepaid expenses Total current assets Property and equipment Total assets $21,000 $160,000 $300,000 $9,000 $490,000 $810,000 $1,300,000 $24,000 $162,000 $315,000 $10,000 $511,000 $700,000 $1,211,000 Liabilities and shareholders equity Liabilities Current liabilities 10% bonds...
 PLEASE DO THE ABOVE QUESTION SIMILAR TO THIS
:
Question 3 The recent financial statements for the Royal Caribbean Company are given below: 2006 2005 Balance Sheet for the period ending June 30 Assets Current assets Cash Accounts receivables Inventories Prepaid expenses Total current assets Property and equipment Total assets $21,000 $160,000 $300,000 $9,000 $490,000 $810,000 $1,300,000 $24,000 $162,000 $315,000 $10,000 $511,000 $700,000 $1,211,000 Liabilities and shareholders equity Liabilities Current liabilities 10% bonds payable Total liabilities $200,000 $300,000 $500,000 $290,000...
PLEASE DO THE ABOVE QUESTION SIMILAR TO THIS
:
Question 3 The recent financial statements for the Royal Caribbean Company are given below: 2006 2005 Balance Sheet for the period ending June 30 Assets Current assets Cash Accounts receivables Inventories Prepaid expenses Total current assets Property and equipment Total assets $21,000 $160,000 $300,000 $9,000 $490,000 $810,000 $1,300,000 $24,000 $162,000 $315,000 $10,000 $511,000 $700,000 $1,211,000 Liabilities and shareholders equity Liabilities Current liabilities 10% bonds payable Total liabilities $200,000 $300,000 $500,000 $290,000...
 Question 4 Daniel, an investor is considering purchasing shares in either Garth Ltd & James Ltd. Both companies are in the same line of business and their accounts are summarized below: Statement of financial Position as at December 1st 2016 Assets Garth Ltd James Ltd. Non Current Assets S'000 S'000 S'000 S'000 2 140 840 At Cost Accumulated Depreciation (226) 1 852 614 (280) Current Assets 276 334 Inventory Receivables 138 196 Bank and Cash 192 606 18 548 1...
 Question 3 The recent financial statements for the Royal Caribbean Company are given below: 2006 2005 Balance Sheet for the period ending June 30 Assets Current assets Cash Accounts receivables Inventories Prepaid expenses Total current assets Property and equipment Total assets $21,000 $160,000 $300,000 $9,000 $490,000 $810,000 $1,300,000 $24,000 $162,000 $315,000 $10,000 $511,000 $700,000 $1,211,000 Liabilities and shareholders equity Liabilities Current liabilities 10% bonds payable Total liabilities $200,000 $300,000 $500,000 $290,000 $275,000 $565,000 Shareholders equity Common stock $5 per share...
 Calculate the ratios below given the financial data presented to your left. Answers Measures of Short-term Liquidity current assets / current liabilities quick assets / current liabilities net sales /accounts receivable 365 days/receivables turnover rate cost of goods sold/inventory current ratio quick ratico receivables turnover rate days to collect receivables inventory turnover rate Measures of Long-term Credit Risk total liabilities/total assets operating income /annual interest expense debt ratio Times Interest Earned Measures of Profitability net income / sales net income/total...
 Kindly, correct me if I am
wrong.
Income statement (represents profitability in period of time) Sales (Revenue) Total sales Cost of goods sold (COGS) Gross profit SALES - COGS Depreciation (operational cost) (x) Selling & admin expenses (operational cost) Operating profit (net income) Gross profit - (X+Y) Interest expenses (interest) Earnings before Taxes Operating profit - interest Taxes (TAX) Earnings after Taxes EBT-TAX Ration Analysis Liquidity Ratio: ► Ability to meet short term immediate obligations ► Current Ratio (C.R) =...
Kindly, correct me if I am
wrong.
Income statement (represents profitability in period of time) Sales (Revenue) Total sales Cost of goods sold (COGS) Gross profit SALES - COGS Depreciation (operational cost) (x) Selling & admin expenses (operational cost) Operating profit (net income) Gross profit - (X+Y) Interest expenses (interest) Earnings before Taxes Operating profit - interest Taxes (TAX) Earnings after Taxes EBT-TAX Ration Analysis Liquidity Ratio: ► Ability to meet short term immediate obligations ► Current Ratio (C.R) =...
 PROJECT:
Select any bank / firm of your choice. Take out its financial
statements.
Calculate the following ratios according to the information
found in these statements.
(NOTE: Show your workings)
1. Operating Cycle. Inventory Number of days of inventory - Average day's cost of goods sold Inventory cost of goods sold / 305 Number of days of receivables = Accounts receivable Average day's sales on credit Accounts receivable Sales on credit / 365 Number of days of payables - Accounts...
PROJECT:
Select any bank / firm of your choice. Take out its financial
statements.
Calculate the following ratios according to the information
found in these statements.
(NOTE: Show your workings)
1. Operating Cycle. Inventory Number of days of inventory - Average day's cost of goods sold Inventory cost of goods sold / 305 Number of days of receivables = Accounts receivable Average day's sales on credit Accounts receivable Sales on credit / 365 Number of days of payables - Accounts...
Most questions answered within 3 hours.
-
The USPS sells money orders identified by an 11 –digit number
x1, x2, …, x11. The...
asked 15 seconds ago -
Provide an example of equilibrium in relation to
Newton’s First and Second Laws. Explain your answer....
asked 1 minute ago -
You are __________ to commit a Type I error using the 0.05 level
of significance than...
asked 19 minutes ago -
1. the following results are obtained:
200
kiwi
575 wild-type
What can we conclude about the...
asked 24 minutes ago -
Explain how you might use E. coli bacteria to produce human
growth hormone using the following:...
asked 25 minutes ago -
WHAT IS THE EFFEKT OF ADD K2CO3 TO ( METHANOL OG WATER)?
asked 39 minutes ago -
Calculate the cell potential, the equilibrium constant, and the
free-energy change for: Ca(s)+Mn2+(aq)(1M)⇌Ca2+(aq)(1M)+Mn(s) given
the following...
asked 37 minutes ago -
Determine the pH at the equivalence (stoichiometric) point in
the titration of 48 mL of 0.28...
asked 36 minutes ago -
11. In CPM/PERT, an activity that is on the critical path
A. has equal values for...
asked 43 minutes ago -
Using C++ :
A Pascals triangle row is constructed by looking at the previous
row and...
asked 1 hour ago -
With what speed will the fastest photoelectrons be emitted from
a surface whose threshold wavelength is...
asked 1 hour ago -
The following slope distances and differences in elevations
between the tape ends were recorded for a...
asked 1 hour ago