

DO NOT WRITE ANSWERS !! PLEASE TYPE ANSWERS SO THEY CAN LOOK SIMILAR TO THIS :

AGAIN PLEASE TYPE ANSWERS SO THEY CAN LOOK SIMILAR TO THE ABOVE PHOTO !!
Homework Answers
| a | |||||||||
| 2006 | 2005 | ||||||||
| Gross Margin percentage | (gross profit/Sales)*100 | =(840000/2100000)*100 | =(710000/1900000)*100 | ||||||
| 40 | 37.37 | ||||||||
| Net Income percentage | (net profit/Sales)*100 | =(180000/2100000)*100 | =(200000/1900000)*100 | ||||||
| 8.57 | 10.53 | ||||||||
| Current ratio | Current asset/Current liabilities | =490000/200000 | =511000/290000 | ||||||
| 2.45 | 1.76 | ||||||||
| Acid test ratio | Liquid asset/Current liabilities | =(160000+21000)/200000 | =(162000+24000)/290000 | ||||||
| 0.91 | 0.64 | ||||||||
| Inventory turnover | COGS / Average inventory | =1260000/((300000+315000)/2) | =1190000/((315000+260000)/2) | ||||||
| 4.10 | 4.14 | ||||||||
| Debt to equity ratio | Debt / Equity | =500000/800000 | =565000/(150000+496000) | ||||||
| 0.63 | 0.87 | ||||||||
| Interest cover | Net operating income/Interest | =180000/30000 | =200000/60000 | ||||||
| 6 | 3.33 | ||||||||
| b | |||||||||
| Liquidity | In 2006, liquidity has improved from 1.76 to 2.45 as shown by Current ratio | ||||||||
| Profitability | Net profit have improved too in 2006 from 2005 | ||||||||
Add Answer to:
DO NOT WRITE ANSWERS !! PLEASE TYPE ANSWERS SO THEY CAN
LOOK SIMILAR TO THIS :...
PLEASE TYPE ANSWERS. DO NOT WRITE ! IT SHOULD LOOK SIMILAR TO THIS (SEE IMAGE BELOW):...
 PLEASE TYPE ANSWERS. DO NOT WRITE ! IT SHOULD LOOK
SIMILAR TO THIS (SEE IMAGE BELOW):
2006 2005 Balance Sheet for the period ending June 30 Assets Current assets Cash Accounts receivables Inventories Prepaid expenses Total current assets Property and equipment Total assets $21,000 $160,000 $300,000 $9,000 $490,000 $810,000 $1,300,000 $24,000 $162,000 $315,000 $10,000 $511,000 $700,000 $1,211,000 Liabilities and shareholders equity Liabilities Current liabilities 10% bonds payable Total liabilities $200,000 $300,000 $500,000 $290,000 $275,000 $565,000 Shareholders equity Common stock $5...
PLEASE TYPE ANSWERS. DO NOT WRITE ! IT SHOULD LOOK
SIMILAR TO THIS (SEE IMAGE BELOW):
2006 2005 Balance Sheet for the period ending June 30 Assets Current assets Cash Accounts receivables Inventories Prepaid expenses Total current assets Property and equipment Total assets $21,000 $160,000 $300,000 $9,000 $490,000 $810,000 $1,300,000 $24,000 $162,000 $315,000 $10,000 $511,000 $700,000 $1,211,000 Liabilities and shareholders equity Liabilities Current liabilities 10% bonds payable Total liabilities $200,000 $300,000 $500,000 $290,000 $275,000 $565,000 Shareholders equity Common stock $5...
PLEASE TYPE THIS ON A COMPUTER SO IT CAN BE NEAT LIKE THE IMAGE BELOW !!...
 PLEASE TYPE THIS ON A COMPUTER SO
IT CAN BE NEAT LIKE THE IMAGE BELOW !! PLEASE DO NOT WRITE. TYPE
THE ANSWER SO IT CAN BE SIMILAR TO THIS :
2006 2005 Balance Sheet for the period ending June 30 Assets Current assets Cash Accounts receivables Inventories Prepaid expenses Total current assets Property and equipment Total assets $21,000 $160,000 $300,000 $9,000 $490,000 $810,000 $1,300,000 $24,000 $162,000 $315,000 $10,000 $511,000 $700,000 $1,211,000 Liabilities and shareholders equity Liabilities Current liabilities 10%...
PLEASE TYPE THIS ON A COMPUTER SO
IT CAN BE NEAT LIKE THE IMAGE BELOW !! PLEASE DO NOT WRITE. TYPE
THE ANSWER SO IT CAN BE SIMILAR TO THIS :
2006 2005 Balance Sheet for the period ending June 30 Assets Current assets Cash Accounts receivables Inventories Prepaid expenses Total current assets Property and equipment Total assets $21,000 $160,000 $300,000 $9,000 $490,000 $810,000 $1,300,000 $24,000 $162,000 $315,000 $10,000 $511,000 $700,000 $1,211,000 Liabilities and shareholders equity Liabilities Current liabilities 10%...
RATIO ANALYSIS PLEASE ANSWER THIS USING A COMPUTER , TYPE ANSWERS ON A COMPUTER !! DO...
 RATIO ANALYSIS
PLEASE ANSWER THIS USING A COMPUTER , TYPE ANSWERS ON A
COMPUTER !! DO NOT WRITE !! I WOULD LIKE ANSWERS TO LOOK SIMILAR TO
THIS LAYOUT :
2006 2005 Balance Sheet for the period ending June 30 Assets Current assets Cash Accounts receivables Inventories Prepaid expenses Total current assets Property and equipment Total assets $21,000 $160,000 $300,000 $9,000 $490,000 $810,000 $1,300,000 $24,000 $162,000 $315,000 $10,000 $511,000 $700,000 $1,211,000 Liabilities and shareholders equity Liabilities Current liabilities 10% bonds...
RATIO ANALYSIS
PLEASE ANSWER THIS USING A COMPUTER , TYPE ANSWERS ON A
COMPUTER !! DO NOT WRITE !! I WOULD LIKE ANSWERS TO LOOK SIMILAR TO
THIS LAYOUT :
2006 2005 Balance Sheet for the period ending June 30 Assets Current assets Cash Accounts receivables Inventories Prepaid expenses Total current assets Property and equipment Total assets $21,000 $160,000 $300,000 $9,000 $490,000 $810,000 $1,300,000 $24,000 $162,000 $315,000 $10,000 $511,000 $700,000 $1,211,000 Liabilities and shareholders equity Liabilities Current liabilities 10% bonds...
PLEASE DO THE ABOVE QUESTION SIMILAR TO THIS : Question 3 The recent financial statements for the Royal Caribbean Com...
 PLEASE DO THE ABOVE QUESTION SIMILAR TO THIS
:
Question 3 The recent financial statements for the Royal Caribbean Company are given below: 2006 2005 Balance Sheet for the period ending June 30 Assets Current assets Cash Accounts receivables Inventories Prepaid expenses Total current assets Property and equipment Total assets $21,000 $160,000 $300,000 $9,000 $490,000 $810,000 $1,300,000 $24,000 $162,000 $315,000 $10,000 $511,000 $700,000 $1,211,000 Liabilities and shareholders equity Liabilities Current liabilities 10% bonds payable Total liabilities $200,000 $300,000 $500,000 $290,000...
PLEASE DO THE ABOVE QUESTION SIMILAR TO THIS
:
Question 3 The recent financial statements for the Royal Caribbean Company are given below: 2006 2005 Balance Sheet for the period ending June 30 Assets Current assets Cash Accounts receivables Inventories Prepaid expenses Total current assets Property and equipment Total assets $21,000 $160,000 $300,000 $9,000 $490,000 $810,000 $1,300,000 $24,000 $162,000 $315,000 $10,000 $511,000 $700,000 $1,211,000 Liabilities and shareholders equity Liabilities Current liabilities 10% bonds payable Total liabilities $200,000 $300,000 $500,000 $290,000...
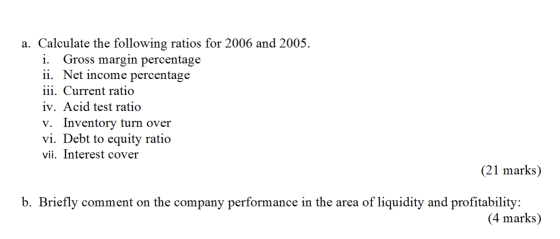
Question 4 Daniel, an investor is considering purchasing shares in either Garth Ltd & James Ltd....
 Question 4 Daniel, an investor is considering purchasing shares in either Garth Ltd & James Ltd. Both companies are in the same line of business and their accounts are summarized below: Statement of financial Position as at December 1st 2016 Assets Garth Ltd James Ltd. Non Current Assets S'000 S'000 S'000 S'000 2 140 840 At Cost Accumulated Depreciation (226) 1 852 614 (280) Current Assets 276 334 Inventory Receivables 138 196 Bank and Cash 192 606 18 548 1...
Question 3 The recent financial statements for the Royal Caribbean Company are given below: 2006 2005 Balance Sheet for...
 Question 3 The recent financial statements for the Royal Caribbean Company are given below: 2006 2005 Balance Sheet for the period ending June 30 Assets Current assets Cash Accounts receivables Inventories Prepaid expenses Total current assets Property and equipment Total assets $21,000 $160,000 $300,000 $9,000 $490,000 $810,000 $1,300,000 $24,000 $162,000 $315,000 $10,000 $511,000 $700,000 $1,211,000 Liabilities and shareholders equity Liabilities Current liabilities 10% bonds payable Total liabilities $200,000 $300,000 $500,000 $290,000 $275,000 $565,000 Shareholders equity Common stock $5 per share...
please do Waterloo Corporation Statement of Financial Position 31-Dec 2015 2014 2013 Assets Cash $32,000 $19,000...
 please do
Waterloo Corporation Statement of Financial Position 31-Dec 2015 2014 2013 Assets Cash $32,000 $19,000 $10,000 Accounts Receivable (net) 95,000 70,000 53,000 Inventory 81,000 71,000 53,000 Other current assets 65,000 49,000 61,000 Long-term investments 120,000 76,000 50,000 Property, Plant & Equipment (net) 598,000 345,000 315.000 Total Assets $991,000 $630,000 $542,000 $71,500 245.000 316,500 $56,000 75.000 131,000 $65,000 78,000 143,000 Liabilities & Shareholders' Equity Liabilities Current Liabilities Non-current liabilities Total Liabilities Shareholders' Equity Common Shares Retained Earnings Total Shareholders' Equity...
please do
Waterloo Corporation Statement of Financial Position 31-Dec 2015 2014 2013 Assets Cash $32,000 $19,000 $10,000 Accounts Receivable (net) 95,000 70,000 53,000 Inventory 81,000 71,000 53,000 Other current assets 65,000 49,000 61,000 Long-term investments 120,000 76,000 50,000 Property, Plant & Equipment (net) 598,000 345,000 315.000 Total Assets $991,000 $630,000 $542,000 $71,500 245.000 316,500 $56,000 75.000 131,000 $65,000 78,000 143,000 Liabilities & Shareholders' Equity Liabilities Current Liabilities Non-current liabilities Total Liabilities Shareholders' Equity Common Shares Retained Earnings Total Shareholders' Equity...
Kindly, correct me if I am wrong. Income statement (represents profitability in period of time) Sales...
 Kindly, correct me if I am
wrong.
Income statement (represents profitability in period of time) Sales (Revenue) Total sales Cost of goods sold (COGS) Gross profit SALES - COGS Depreciation (operational cost) (x) Selling & admin expenses (operational cost) Operating profit (net income) Gross profit - (X+Y) Interest expenses (interest) Earnings before Taxes Operating profit - interest Taxes (TAX) Earnings after Taxes EBT-TAX Ration Analysis Liquidity Ratio: ► Ability to meet short term immediate obligations ► Current Ratio (C.R) =...
Kindly, correct me if I am
wrong.
Income statement (represents profitability in period of time) Sales (Revenue) Total sales Cost of goods sold (COGS) Gross profit SALES - COGS Depreciation (operational cost) (x) Selling & admin expenses (operational cost) Operating profit (net income) Gross profit - (X+Y) Interest expenses (interest) Earnings before Taxes Operating profit - interest Taxes (TAX) Earnings after Taxes EBT-TAX Ration Analysis Liquidity Ratio: ► Ability to meet short term immediate obligations ► Current Ratio (C.R) =...
1. Given the 2019 ratios of Verizon wireless what do EACH of these ratios indicate about...
1. Given the 2019 ratios of Verizon wireless what do EACH of these ratios indicate about the company specifically? (not just as a whole) 2. Lastly, at the end, in one paragraph what do these calculations (all together) mean for the companies financial health? Answers must be broken down into everyday language and not in "financial talk" Profit ratios: gross profit margin (gross profit / sales)*100 gross profit 77142000 sales 131868000 gross profit margin 58.50% operating profit margin (operating profit...
please help Waterloo Corporation Statement of Financial Position 31-Dec 2015 2014 2013 Assets Cash $32,000 $19,000...
 please help
Waterloo Corporation Statement of Financial Position 31-Dec 2015 2014 2013 Assets Cash $32,000 $19,000 $10,000 Accounts Receivable (net) 95,000 70,000 53,000 Inventory 81,000 71,000 53,000 Other current assets 65,000 49,000 61,000 Long-term investments 120,000 76,000 50,000 Property, Plant & Equipment (net) 598,000 345,000 315.000 Total Assets $991,000 $630,000 $542,000 $71,500 245.000 316,500 $56,000 75.000 131,000 $65,000 78,000 143,000 Liabilities & Shareholders' Equity Liabilities Current Liabilities Non-current liabilities Total Liabilities Shareholders' Equity Common Shares Retained Earnings Total Shareholders' Equity...
please help
Waterloo Corporation Statement of Financial Position 31-Dec 2015 2014 2013 Assets Cash $32,000 $19,000 $10,000 Accounts Receivable (net) 95,000 70,000 53,000 Inventory 81,000 71,000 53,000 Other current assets 65,000 49,000 61,000 Long-term investments 120,000 76,000 50,000 Property, Plant & Equipment (net) 598,000 345,000 315.000 Total Assets $991,000 $630,000 $542,000 $71,500 245.000 316,500 $56,000 75.000 131,000 $65,000 78,000 143,000 Liabilities & Shareholders' Equity Liabilities Current Liabilities Non-current liabilities Total Liabilities Shareholders' Equity Common Shares Retained Earnings Total Shareholders' Equity...
 PLEASE TYPE ANSWERS. DO NOT WRITE ! IT SHOULD LOOK
SIMILAR TO THIS (SEE IMAGE BELOW):
2006 2005 Balance Sheet for the period ending June 30 Assets Current assets Cash Accounts receivables Inventories Prepaid expenses Total current assets Property and equipment Total assets $21,000 $160,000 $300,000 $9,000 $490,000 $810,000 $1,300,000 $24,000 $162,000 $315,000 $10,000 $511,000 $700,000 $1,211,000 Liabilities and shareholders equity Liabilities Current liabilities 10% bonds payable Total liabilities $200,000 $300,000 $500,000 $290,000 $275,000 $565,000 Shareholders equity Common stock $5...
PLEASE TYPE ANSWERS. DO NOT WRITE ! IT SHOULD LOOK
SIMILAR TO THIS (SEE IMAGE BELOW):
2006 2005 Balance Sheet for the period ending June 30 Assets Current assets Cash Accounts receivables Inventories Prepaid expenses Total current assets Property and equipment Total assets $21,000 $160,000 $300,000 $9,000 $490,000 $810,000 $1,300,000 $24,000 $162,000 $315,000 $10,000 $511,000 $700,000 $1,211,000 Liabilities and shareholders equity Liabilities Current liabilities 10% bonds payable Total liabilities $200,000 $300,000 $500,000 $290,000 $275,000 $565,000 Shareholders equity Common stock $5...
 PLEASE TYPE THIS ON A COMPUTER SO
IT CAN BE NEAT LIKE THE IMAGE BELOW !! PLEASE DO NOT WRITE. TYPE
THE ANSWER SO IT CAN BE SIMILAR TO THIS :
2006 2005 Balance Sheet for the period ending June 30 Assets Current assets Cash Accounts receivables Inventories Prepaid expenses Total current assets Property and equipment Total assets $21,000 $160,000 $300,000 $9,000 $490,000 $810,000 $1,300,000 $24,000 $162,000 $315,000 $10,000 $511,000 $700,000 $1,211,000 Liabilities and shareholders equity Liabilities Current liabilities 10%...
PLEASE TYPE THIS ON A COMPUTER SO
IT CAN BE NEAT LIKE THE IMAGE BELOW !! PLEASE DO NOT WRITE. TYPE
THE ANSWER SO IT CAN BE SIMILAR TO THIS :
2006 2005 Balance Sheet for the period ending June 30 Assets Current assets Cash Accounts receivables Inventories Prepaid expenses Total current assets Property and equipment Total assets $21,000 $160,000 $300,000 $9,000 $490,000 $810,000 $1,300,000 $24,000 $162,000 $315,000 $10,000 $511,000 $700,000 $1,211,000 Liabilities and shareholders equity Liabilities Current liabilities 10%...
 RATIO ANALYSIS
PLEASE ANSWER THIS USING A COMPUTER , TYPE ANSWERS ON A
COMPUTER !! DO NOT WRITE !! I WOULD LIKE ANSWERS TO LOOK SIMILAR TO
THIS LAYOUT :
2006 2005 Balance Sheet for the period ending June 30 Assets Current assets Cash Accounts receivables Inventories Prepaid expenses Total current assets Property and equipment Total assets $21,000 $160,000 $300,000 $9,000 $490,000 $810,000 $1,300,000 $24,000 $162,000 $315,000 $10,000 $511,000 $700,000 $1,211,000 Liabilities and shareholders equity Liabilities Current liabilities 10% bonds...
RATIO ANALYSIS
PLEASE ANSWER THIS USING A COMPUTER , TYPE ANSWERS ON A
COMPUTER !! DO NOT WRITE !! I WOULD LIKE ANSWERS TO LOOK SIMILAR TO
THIS LAYOUT :
2006 2005 Balance Sheet for the period ending June 30 Assets Current assets Cash Accounts receivables Inventories Prepaid expenses Total current assets Property and equipment Total assets $21,000 $160,000 $300,000 $9,000 $490,000 $810,000 $1,300,000 $24,000 $162,000 $315,000 $10,000 $511,000 $700,000 $1,211,000 Liabilities and shareholders equity Liabilities Current liabilities 10% bonds...
 PLEASE DO THE ABOVE QUESTION SIMILAR TO THIS
:
Question 3 The recent financial statements for the Royal Caribbean Company are given below: 2006 2005 Balance Sheet for the period ending June 30 Assets Current assets Cash Accounts receivables Inventories Prepaid expenses Total current assets Property and equipment Total assets $21,000 $160,000 $300,000 $9,000 $490,000 $810,000 $1,300,000 $24,000 $162,000 $315,000 $10,000 $511,000 $700,000 $1,211,000 Liabilities and shareholders equity Liabilities Current liabilities 10% bonds payable Total liabilities $200,000 $300,000 $500,000 $290,000...
PLEASE DO THE ABOVE QUESTION SIMILAR TO THIS
:
Question 3 The recent financial statements for the Royal Caribbean Company are given below: 2006 2005 Balance Sheet for the period ending June 30 Assets Current assets Cash Accounts receivables Inventories Prepaid expenses Total current assets Property and equipment Total assets $21,000 $160,000 $300,000 $9,000 $490,000 $810,000 $1,300,000 $24,000 $162,000 $315,000 $10,000 $511,000 $700,000 $1,211,000 Liabilities and shareholders equity Liabilities Current liabilities 10% bonds payable Total liabilities $200,000 $300,000 $500,000 $290,000...
 Question 4 Daniel, an investor is considering purchasing shares in either Garth Ltd & James Ltd. Both companies are in the same line of business and their accounts are summarized below: Statement of financial Position as at December 1st 2016 Assets Garth Ltd James Ltd. Non Current Assets S'000 S'000 S'000 S'000 2 140 840 At Cost Accumulated Depreciation (226) 1 852 614 (280) Current Assets 276 334 Inventory Receivables 138 196 Bank and Cash 192 606 18 548 1...
 Question 3 The recent financial statements for the Royal Caribbean Company are given below: 2006 2005 Balance Sheet for the period ending June 30 Assets Current assets Cash Accounts receivables Inventories Prepaid expenses Total current assets Property and equipment Total assets $21,000 $160,000 $300,000 $9,000 $490,000 $810,000 $1,300,000 $24,000 $162,000 $315,000 $10,000 $511,000 $700,000 $1,211,000 Liabilities and shareholders equity Liabilities Current liabilities 10% bonds payable Total liabilities $200,000 $300,000 $500,000 $290,000 $275,000 $565,000 Shareholders equity Common stock $5 per share...
 please do
Waterloo Corporation Statement of Financial Position 31-Dec 2015 2014 2013 Assets Cash $32,000 $19,000 $10,000 Accounts Receivable (net) 95,000 70,000 53,000 Inventory 81,000 71,000 53,000 Other current assets 65,000 49,000 61,000 Long-term investments 120,000 76,000 50,000 Property, Plant & Equipment (net) 598,000 345,000 315.000 Total Assets $991,000 $630,000 $542,000 $71,500 245.000 316,500 $56,000 75.000 131,000 $65,000 78,000 143,000 Liabilities & Shareholders' Equity Liabilities Current Liabilities Non-current liabilities Total Liabilities Shareholders' Equity Common Shares Retained Earnings Total Shareholders' Equity...
please do
Waterloo Corporation Statement of Financial Position 31-Dec 2015 2014 2013 Assets Cash $32,000 $19,000 $10,000 Accounts Receivable (net) 95,000 70,000 53,000 Inventory 81,000 71,000 53,000 Other current assets 65,000 49,000 61,000 Long-term investments 120,000 76,000 50,000 Property, Plant & Equipment (net) 598,000 345,000 315.000 Total Assets $991,000 $630,000 $542,000 $71,500 245.000 316,500 $56,000 75.000 131,000 $65,000 78,000 143,000 Liabilities & Shareholders' Equity Liabilities Current Liabilities Non-current liabilities Total Liabilities Shareholders' Equity Common Shares Retained Earnings Total Shareholders' Equity...
 Kindly, correct me if I am
wrong.
Income statement (represents profitability in period of time) Sales (Revenue) Total sales Cost of goods sold (COGS) Gross profit SALES - COGS Depreciation (operational cost) (x) Selling & admin expenses (operational cost) Operating profit (net income) Gross profit - (X+Y) Interest expenses (interest) Earnings before Taxes Operating profit - interest Taxes (TAX) Earnings after Taxes EBT-TAX Ration Analysis Liquidity Ratio: ► Ability to meet short term immediate obligations ► Current Ratio (C.R) =...
Kindly, correct me if I am
wrong.
Income statement (represents profitability in period of time) Sales (Revenue) Total sales Cost of goods sold (COGS) Gross profit SALES - COGS Depreciation (operational cost) (x) Selling & admin expenses (operational cost) Operating profit (net income) Gross profit - (X+Y) Interest expenses (interest) Earnings before Taxes Operating profit - interest Taxes (TAX) Earnings after Taxes EBT-TAX Ration Analysis Liquidity Ratio: ► Ability to meet short term immediate obligations ► Current Ratio (C.R) =...
 please help
Waterloo Corporation Statement of Financial Position 31-Dec 2015 2014 2013 Assets Cash $32,000 $19,000 $10,000 Accounts Receivable (net) 95,000 70,000 53,000 Inventory 81,000 71,000 53,000 Other current assets 65,000 49,000 61,000 Long-term investments 120,000 76,000 50,000 Property, Plant & Equipment (net) 598,000 345,000 315.000 Total Assets $991,000 $630,000 $542,000 $71,500 245.000 316,500 $56,000 75.000 131,000 $65,000 78,000 143,000 Liabilities & Shareholders' Equity Liabilities Current Liabilities Non-current liabilities Total Liabilities Shareholders' Equity Common Shares Retained Earnings Total Shareholders' Equity...
please help
Waterloo Corporation Statement of Financial Position 31-Dec 2015 2014 2013 Assets Cash $32,000 $19,000 $10,000 Accounts Receivable (net) 95,000 70,000 53,000 Inventory 81,000 71,000 53,000 Other current assets 65,000 49,000 61,000 Long-term investments 120,000 76,000 50,000 Property, Plant & Equipment (net) 598,000 345,000 315.000 Total Assets $991,000 $630,000 $542,000 $71,500 245.000 316,500 $56,000 75.000 131,000 $65,000 78,000 143,000 Liabilities & Shareholders' Equity Liabilities Current Liabilities Non-current liabilities Total Liabilities Shareholders' Equity Common Shares Retained Earnings Total Shareholders' Equity...
Most questions answered within 3 hours.
-
Arthur Meiners is the production manager of Wheel-Rite, a small
producer of metal parts. Wheel-Rite supplies...
asked 11 minutes ago -
Company Risk Premium A company has a beta of
4.57. If the market return is expected...
asked 10 minutes ago -
3. Which statement about nuclear fission is correct? (1
point)
A. Nuclear fission provides energy for...
asked 16 minutes ago -
If a $2,000 increase in income leads to a $1,5000 increase in
consumption expenditures, then the...
asked 15 minutes ago -
May you please put this in layman's terms?
ABSTRACT
Coagulase-negative staphylococci (CoNS) and Staphylococcus
aureus are...
asked 20 minutes ago -
If authentic leadership is really a lifelong process,
can teenagers be authentic leaders? Why or why...
asked 36 minutes ago -
Six years of quarterly data of a seasonally adjusted series are
used to estimate a linear...
asked 54 minutes ago -
Which of the following is not an ecological model used
to foster behavior change?
PRECEDE-PROCEED Model...
asked 58 minutes ago -
On the Apollo 14 mission to the moon, astronaut Alan Shepard hit
a golf ball with...
asked 54 minutes ago -
What are John’s potential claims if he is terminated
this week?
John is a 54-year-old man...
asked 1 hour ago -
A (8.5) cm tall object is placed at a distance of (14.2) cm from
a convex...
asked 1 hour ago -
(2) For the following questions, consider a data set that
exhibits a normal distribution. Report the...
asked 1 hour ago