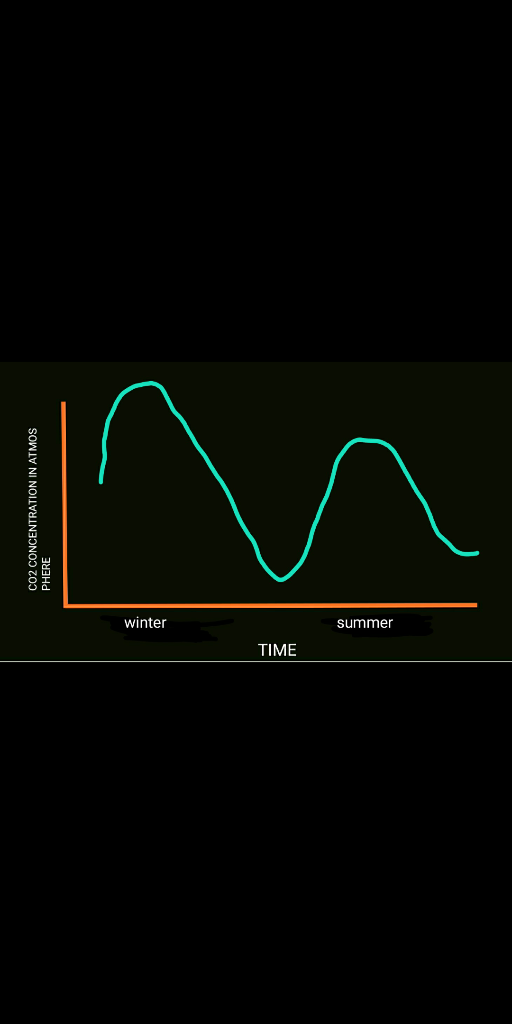
The curve in the following figure shows the measurement of the concentration of carbon dioxide in a place where bonfires are being held.

A. What can be concluded from the graph on the concentration of
carbon dioxide?
B. What does the increase stem from? Explain your answer.
C. What does the decrease stem from? Explain your answer.
D. Draw a curve showing the concentration of carbon dioxide in the same place on a normal day. Explain the illustration. What can cause changes in the concentration of carbon dioxide in the air? Explain.
E. Draw the concentration of carbon dioxide in a city throughout the year. Explain your illustration.
Thank you!!!
Homework Answers
A. From the graph, we can see that CO2 concentratoon initially increases and reach a peak at around 17 hours in the evening. It means bonfires in that area are used in the evening maainly. This may be due to following reasons -
1. In the city, the temperature in the evening may significantly fall down when the sun is not over the head. People use this to warm themselves.
2. People who may travel from one place to another may use bonfires to locate lanes.
B. Increasing stem depicts the concentration of CO2 of areas which either use less bonfires normally or use less bonfires when the sun is over the head.
C. Decreasing stem depicts the concentration of CO2 of areas where people stop using bonfires at night when they go to sleep. You may notice that decreasing stem is morr gradual as compared to increasing stem. This may be due to use of bonfires by travellers at night or by people living in slums.
One more possible reason for B and C is that, bonfires take some to reach their maxima. People start there bonfires at around 12 hours in the afternoon and the bonfire reaches peak at 17 hours. At this time the concentration of CO2 is maximum. Then the bonfire starts to decrease in its intensity and reaches least at around 6 hours.
D. We can assume that people living in cold areas use bonfires. So, the graph given to us is for a cold area which uses bonfires. If the area does not use bonfires, then the graph would be like -

In a cold region (or when temperature is low), plant photosynthesize minimally so, CO2 concentration is high in atmosphere during day. At night, stomata in plants closes so, even less photosynthesis is there and there will be morr CO2 in night than day.
This graph is made ignoring all other factors (bonfires, combustion of fuel, pollution etc.)
E. Through out the area, when there are winters, CO2 concentration will be high. Because at cold temperature, plants minimize photosynthesis, uptake less CO2 from environment and so the atmospheric CO2 concentration is high.
Conversely, plants maximixe photosynthesis in summer and take up more CO2 from the atmosphere. So, CO2 concentration in environment is less.
Please rate.
Add Answer to:
The curve in the following figure shows the measurement of the concentration of carbon dioxide in...
Air pollution control specialists monitor the amount of ozone, carbon dioxide, and nitrogen dioxide in the...
Air pollution control specialists monitor the amount of ozone, carbon dioxide, and nitrogen dioxide in the air on a daily basis. Throughout the first weekend of November the specialists recorded the levels of nitrogen dioxide every 3 hours (i.e. at 12am/pm, 3am/pm, 6am/pm, 9am/pm) each day. Day Hour NO2 Level 1-Nov 12:00 AM 35 3:00 AM 25 6:00 AM 32 9:00 AM 45 12:00 PM 40 3:00 PM 25 6:00 PM 36 9:00 PM 50 2-Nov 12:00 AM 42 3:00...
Draw the demand curve for an environmental service, for example carbon sequestration (process of capture and...
Draw the demand curve for an environmental service, for example carbon sequestration (process of capture and long-term storage of atmospheric carbon-dioxide) from tree planting and discuss what its slope means as a measure of willingness to pay for the service (explain the direction of slope). Label the axes on your graphs clearly.
Concentration of CO2 in the Atmosphere Levels of carbon dioxide (CO2) in the atmosphere are rising...
 Concentration of CO2 in the Atmosphere Levels of carbon dioxide (CO2) in the atmosphere are rising rapidly, far above any levels ever before recorded. Levels were around 278 parts per million in 1800, before the Industrial Age, and had never, in the hundreds of thousands of years before that, gone above 300 ppm. Levels are now nearing 400 ppm. Table 1 shows the rapid rise of CO2 concentrations over the last 50 years, also available in CarbonDioxide.1 We can use...
please, i need help as soon as possible. please, i need help as soon as possible....
 please, i need help as soon as possible.
B- AutoSave Of H File Home Insert Assignment2 (1) - Excel Page Layout Formulas Data Parta Draw fo Review A1 x 1 Parta 2 Pattern: Time Series Plot SUSAN 19 Part 6 20 Regression Model: 21 Estimated Nitrogen Dioxide 9-10am: 22 Estimated Nitrogen Dioxide 3-4pm: 24. Part 25 Regression Model: 26 Estimated Nitrogen Dioxide 9-10am: 27 Estimated Nitrogen Dioxide 3-4pm: 29 Part 01 02...
please, i need help as soon as possible.
please, i need help as soon as possible.
B- AutoSave Of H File Home Insert Assignment2 (1) - Excel Page Layout Formulas Data Parta Draw fo Review A1 x 1 Parta 2 Pattern: Time Series Plot SUSAN 19 Part 6 20 Regression Model: 21 Estimated Nitrogen Dioxide 9-10am: 22 Estimated Nitrogen Dioxide 3-4pm: 24. Part 25 Regression Model: 26 Estimated Nitrogen Dioxide 9-10am: 27 Estimated Nitrogen Dioxide 3-4pm: 29 Part 01 02...
Suplementary Questions Carbon Dioxide Conclusions 1. Can a candle burn in carbon dioxide? Does ca...
 Suplementary Questions Carbon Dioxide Conclusions 1. Can a candle burn in carbon dioxide? Does carbon dioxide burn? 2. What happened to the burning candle? Could carbon dioxide be used as a fire extinguisher? 3. Why should you release the carbon dioxide into the bottom of the cup? Hydrogen Conclusions 1. What difference did you notice between Parts 1 and 2 in the hydrogen experiment? Explain. 2. What is the purpose of the soap solution? 3. Why should extreme care be...
When a plant grows, the atoms used come from carbon dioxide in the air and water....
When a plant grows, the atoms used come from carbon dioxide in the air and water. Plants are able to accomplish this through the process of photosynthesis, cellular respiration and biosynthesis of macromolecules. Briefly explain the light-independent reactions of photosynthesis: where does this take place, what are the reactants and what is produced? How do plants store excess product from these reactions?
The following plot shows the plasma concentration versus time observed from the administration of 10 mg...
 The following plot shows the plasma concentration versus time observed from the administration of 10 mg IV-Bolus of Drug-A. What is approximately the half-life of Drug-A in this subject? 200.0 180.0 160.0 140.0 120.0 100.0 80.0 60.0 0.0 20.0 0.0 0 12 34 5 6789 10 11 12 13 14 15 16 17 18 19 20 21 22 23 24 25 26 Time (hours)
.) Carbon Cycle Atmospheric CO, at Mauna Loa Observatory 00Scripps Institution of Oceanography NOAA Earth System...
 .) Carbon Cycle Atmospheric CO, at Mauna Loa Observatory 00Scripps Institution of Oceanography NOAA Earth System Research Laboratory 380 360 340 nona 320 1960 1970 1980 1990 2000 2010 2020 YEAR a.) Above is a graph of carbon dioxide (CO2) concentration in the atmosphere in parts per million (ppm volume) over time. Explain the variations of carbon dioxide over time. (6 points) b.) About 9 gigatons of C per year enter the atmosphere from the burning of fossil fuels, yet...
QUESTION 4 The following table shows the per-person carbon dioxide emissions for the United States and...
 QUESTION 4 The following table shows the per-person carbon dioxide emissions for the United States and for the rest of the world over six years Non U.S. U.S. 4.2 18 3.8 175 4 17 186 3.9 17.5 3.8 16.5 The least squares regression equation is 9 3 20.9878 - 0.9175x. If the non-US emissions differ by 0.5 from one year to the next by how much would you predict the U.S. emissions to differ? O 0.46 -0.46 0 -0.92 -183
please draw a graph thank you. A RELATED PROBLEM: (to be turned in) The carbon dioxide (CO2) content of water in a p...
 please draw a graph thank you.
A RELATED PROBLEM: (to be turned in) The carbon dioxide (CO2) content of water in a pond varies continually because of biological activity. Plants take CO2 from apond during the day for photosynthesis and put CO2 into a pond at night. Animals put CO2 into a pond all the time as they breathe. the rate. f@ at which the CO2 content of the water in a pond changes as a function of the timef...
please draw a graph thank you.
A RELATED PROBLEM: (to be turned in) The carbon dioxide (CO2) content of water in a pond varies continually because of biological activity. Plants take CO2 from apond during the day for photosynthesis and put CO2 into a pond at night. Animals put CO2 into a pond all the time as they breathe. the rate. f@ at which the CO2 content of the water in a pond changes as a function of the timef...
 Concentration of CO2 in the Atmosphere Levels of carbon dioxide (CO2) in the atmosphere are rising rapidly, far above any levels ever before recorded. Levels were around 278 parts per million in 1800, before the Industrial Age, and had never, in the hundreds of thousands of years before that, gone above 300 ppm. Levels are now nearing 400 ppm. Table 1 shows the rapid rise of CO2 concentrations over the last 50 years, also available in CarbonDioxide.1 We can use...
 please, i need help as soon as possible.
B- AutoSave Of H File Home Insert Assignment2 (1) - Excel Page Layout Formulas Data Parta Draw fo Review A1 x 1 Parta 2 Pattern: Time Series Plot SUSAN 19 Part 6 20 Regression Model: 21 Estimated Nitrogen Dioxide 9-10am: 22 Estimated Nitrogen Dioxide 3-4pm: 24. Part 25 Regression Model: 26 Estimated Nitrogen Dioxide 9-10am: 27 Estimated Nitrogen Dioxide 3-4pm: 29 Part 01 02...
please, i need help as soon as possible.
please, i need help as soon as possible.
B- AutoSave Of H File Home Insert Assignment2 (1) - Excel Page Layout Formulas Data Parta Draw fo Review A1 x 1 Parta 2 Pattern: Time Series Plot SUSAN 19 Part 6 20 Regression Model: 21 Estimated Nitrogen Dioxide 9-10am: 22 Estimated Nitrogen Dioxide 3-4pm: 24. Part 25 Regression Model: 26 Estimated Nitrogen Dioxide 9-10am: 27 Estimated Nitrogen Dioxide 3-4pm: 29 Part 01 02...
 Suplementary Questions Carbon Dioxide Conclusions 1. Can a candle burn in carbon dioxide? Does carbon dioxide burn? 2. What happened to the burning candle? Could carbon dioxide be used as a fire extinguisher? 3. Why should you release the carbon dioxide into the bottom of the cup? Hydrogen Conclusions 1. What difference did you notice between Parts 1 and 2 in the hydrogen experiment? Explain. 2. What is the purpose of the soap solution? 3. Why should extreme care be...
 The following plot shows the plasma concentration versus time observed from the administration of 10 mg IV-Bolus of Drug-A. What is approximately the half-life of Drug-A in this subject? 200.0 180.0 160.0 140.0 120.0 100.0 80.0 60.0 0.0 20.0 0.0 0 12 34 5 6789 10 11 12 13 14 15 16 17 18 19 20 21 22 23 24 25 26 Time (hours)
 .) Carbon Cycle Atmospheric CO, at Mauna Loa Observatory 00Scripps Institution of Oceanography NOAA Earth System Research Laboratory 380 360 340 nona 320 1960 1970 1980 1990 2000 2010 2020 YEAR a.) Above is a graph of carbon dioxide (CO2) concentration in the atmosphere in parts per million (ppm volume) over time. Explain the variations of carbon dioxide over time. (6 points) b.) About 9 gigatons of C per year enter the atmosphere from the burning of fossil fuels, yet...
 QUESTION 4 The following table shows the per-person carbon dioxide emissions for the United States and for the rest of the world over six years Non U.S. U.S. 4.2 18 3.8 175 4 17 186 3.9 17.5 3.8 16.5 The least squares regression equation is 9 3 20.9878 - 0.9175x. If the non-US emissions differ by 0.5 from one year to the next by how much would you predict the U.S. emissions to differ? O 0.46 -0.46 0 -0.92 -183
 please draw a graph thank you.
A RELATED PROBLEM: (to be turned in) The carbon dioxide (CO2) content of water in a pond varies continually because of biological activity. Plants take CO2 from apond during the day for photosynthesis and put CO2 into a pond at night. Animals put CO2 into a pond all the time as they breathe. the rate. f@ at which the CO2 content of the water in a pond changes as a function of the timef...
please draw a graph thank you.
A RELATED PROBLEM: (to be turned in) The carbon dioxide (CO2) content of water in a pond varies continually because of biological activity. Plants take CO2 from apond during the day for photosynthesis and put CO2 into a pond at night. Animals put CO2 into a pond all the time as they breathe. the rate. f@ at which the CO2 content of the water in a pond changes as a function of the timef...
Most questions answered within 3 hours.
-
A motor produces a torque of 0.25 N m at an angular velocity of
7200 revolutions...
asked 5 minutes ago -
***Please answer the below java question***
Are static methods inheritable? Can they be overridden?
asked 7 minutes ago -
In reaching her destination, a backpacker walks with an average
velocity of 1.13 m/s, due west....
asked 8 minutes ago -
Write two C programs that run a
server program and a client program concurrently.
Server program:...
asked 7 minutes ago -
Executive Program Practical Connection Assignment
Subject : Operations Security.
Assignment:
Provide a reflection of at least...
asked 17 minutes ago -
Every time Casey is at bat he has a 0.4 probability of
getting on base (assume...
asked 25 minutes ago -
The Walston Company is to be liquidated and has the following
liabilities:
Income taxes
$
9,400...
asked 32 minutes ago -
If
the more comprehensive data is available in MEPS, why does the NHIS
still exist? How...
asked 53 minutes ago -
Koo argues that the Japanese economy in the 1990s suffered from
a balance sheet recession. What...
asked 47 minutes ago -
Automobile mechanics conduct diagnosis tests on 150 new cars of
particular make and model to determine...
asked 41 minutes ago -
11) Find the proceeds of a 5 year non-interest
bearing note for $6500 discounted 2.5 years...
asked 47 minutes ago -
Required: Prepare the consolidated financial statements of
Griffin Ltd at 30 June 2019.
Griffin Ltd is...
asked 56 minutes ago