The instructions on how to do the problem is on the first
picture. Where the answers go is on the last picture attached


Homework Answers
Following are the ratios in the format provided as follows :-
| Ratios | 2017 | 2016 | interpret |
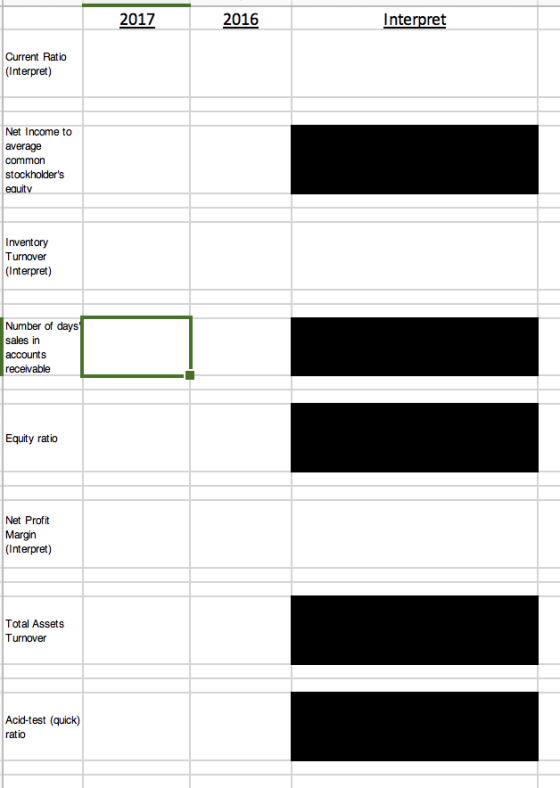
| Current ratio (current assets/current liabilities ) | 1.25 (17724/14133) | 1.32 (16484/12524) | current ratio measures total amount of current assets available in order to satisfy current liabilities. It should be noted that current ratios of the company has reduced from 1.32 in 2016 to 1.25 in 2017. Although the reduction is not too high but still is beyond the desirable which is around 2. Thank s, company must be a little nit bit of concerned for this reduction. |
| Net income to average common stockholder equity ( net income / total stockholder equity) | 1.84 (7957/4333) | 1.11 (7009/6316) | |
| Inventory turnover (cost of goods sold/average inventories ) | 5.11 {62282/(12549+11809/2)} | 5.09 {58254/(11809+11079)/2} | inventory turnover shows how much company is efficient in selling it's inventory. In the present case inventory turnover ratio has increased from 5.09 in 2016 to 5.11 in 2017 which shows company is able to make sales more quickly than earlier. Company must be happy in this case and not concerned . However it would try to further increase the turnover. |
| No. of days sales in accounts receivable (average accounts receivable/total credit sales x no. of days) | 7.56 days [{((2029+1890)/2)/94595}x365] | 6.96 days [{((1890+1484)/2)/88519}x365] | |
| Equity ratio (total stockholder equity / total assets) | 0.10 (4333/42966) | 0.15 (6316/41973) | |
| Net profit margin (net income / sales )x100 | 8.41% (7957/94595)x100 | 7.92% (7009/88519)x100 | Net profit margin shows out of $100 sale how much company is able to earn after paying out all the expenses. In the present case Net profit margin of the company has improved from 7.92% in 2016 to 8.41% in 2017. This, company would be happy and not concerned. However it would made further efforts to improve it further more. |
| Total assets turnover ( sales / average total assets ) | 2.23 {94595/(42966+41973)/2} | 2.16 {88519/(41973+39946)/2} | |
| Acid test (quick) ratio (quick assets / current liabilities ) | 0.37 {(17724-12549)/14133} | 0.37 {(16484-11809)/12524} |
Add Answer to:
The instructions on how to do the problem is on the first
picture. Where the answers...
I am attaching the pictures. the instructions is the first pic and the answers go on...
 I am attaching the pictures. the instructions is the first pic
and the answers go on the last page
The Income Statement and Balance Sheet for The Home Depot, Inc. can be found as separate worksheets on tabs (a) and (b), respectively. On worksheet O, prepare a ratio analysis for 2017 and 2016 that includes the following ratios: Current ratio Net income to average common stockholder's equity Inventory turnover Number of days' sales in accounts receivable (assume 365 days in...
I am attaching the pictures. the instructions is the first pic
and the answers go on the last page
The Income Statement and Balance Sheet for The Home Depot, Inc. can be found as separate worksheets on tabs (a) and (b), respectively. On worksheet O, prepare a ratio analysis for 2017 and 2016 that includes the following ratios: Current ratio Net income to average common stockholder's equity Inventory turnover Number of days' sales in accounts receivable (assume 365 days in...
1. Given the 2019 ratios of Verizon wireless what do EACH of these ratios indicate about...
1. Given the 2019 ratios of Verizon wireless what do EACH of these ratios indicate about the company specifically? (not just as a whole) 2. Lastly, at the end, in one paragraph what do these calculations (all together) mean for the companies financial health? Answers must be broken down into everyday language and not in "financial talk" Profit ratios: gross profit margin (gross profit / sales)*100 gross profit 77142000 sales 131868000 gross profit margin 58.50% operating profit margin (operating profit...
EXERCISE - CHAPTER 19. RATIOS: From the following Information, compute the ratios indicated and place the...
 EXERCISE - CHAPTER 19. RATIOS: From the following Information, compute the ratios indicated and place the proper number in the blanks provided. ASSETS: Cash $10,000 Marketable Securities $15,000 Accounts Receivable, Net $20,000 Inventory $30,000 Prepaid Assets $ 5,000 Property, Plant & Equipment $100,000 Total Assets: $180,000 LIABILITIES & STOCKHOLDERS' EQUITY: Current Liabilities $20,000 Long-Term Liabilities $80,000 Stockholders' Equity $80,000 Total Liabilities & Stockholder's Equity: $180,000 Sales $200,000 Cost of Goods Sold $150.000 Gross Margin $ 50,000 Operating Expense $ 30,000...
Calculate the ratios below given the financial data presented to your left. Answers Measures of Short-term...
 Calculate the ratios below given the financial data presented to your left. Answers Measures of Short-term Liquidity current assets / current liabilities quick assets / current liabilities net sales /accounts receivable 365 days/receivables turnover rate cost of goods sold/inventory current ratio quick ratico receivables turnover rate days to collect receivables inventory turnover rate Measures of Long-term Credit Risk total liabilities/total assets operating income /annual interest expense debt ratio Times Interest Earned Measures of Profitability net income / sales net income/total...
Problem # 1 (50 points) Given the Income Statement and Balance Sheet Compute: Current Ratio Acid-Test...
 Problem # 1 (50 points) Given the Income Statement and Balance Sheet Compute: Current Ratio Acid-Test Ratio Days in Receivable Days in Inventory Operating Profit Margin Total Asset Tumover Fixed-asset turnover Debt Ratio Times Interest Earned Return on Equity Income Statement Balance Sheet Assets Cash Accounts Receivable Inventory Prepaid Expenses Total Current Assets Gross Plant and Equipment Accumulated Depreciation Net Fixed Assets Total Assets $200,000 $60,000 $100,000 $20,000 $380,000 $802,000 -$132,000 $670,000 $1,050,000 Sales (all credit) Cost of Goods Sold...
Can someone please explain how to do this problem please! I would greatly appreciate it? Problem...
 Can someone please explain how to
do this problem please! I would greatly appreciate it?
Problem 13-4A Calculation of financial statement ratios LO P3 Selected year-end financial statements of Cabot Corporation follow. (All sales were on credit; selected balance sheet amounts at December 31, 2016, were inventory, $49,900; total assets, $229,400; common stock, $84,000; and retained earnings, $42,205.) CABOT CORPORATION Income Statement For Year Ended December 31, 2017 Sales $ 452,600 Cost of goods sold 298,350 Gross profit 154,250 Operating...
Can someone please explain how to
do this problem please! I would greatly appreciate it?
Problem 13-4A Calculation of financial statement ratios LO P3 Selected year-end financial statements of Cabot Corporation follow. (All sales were on credit; selected balance sheet amounts at December 31, 2016, were inventory, $49,900; total assets, $229,400; common stock, $84,000; and retained earnings, $42,205.) CABOT CORPORATION Income Statement For Year Ended December 31, 2017 Sales $ 452,600 Cost of goods sold 298,350 Gross profit 154,250 Operating...
please show how numbers are calculated. and all work must be done in excel CHAPTER 3:...
 please show how numbers are calculated. and all work
must be done in excel
CHAPTER 3: FINANCIAL STATEMENT ANALYSIS TOOLS NOTE: PLEASE USE WORKSHEET #3 IN THE ATTACHED EXCEL FILE TITLED "Homework for Chapter 3 Excel TO SOLVE THE FOLLOWING PROBLEM. Homework for Chapter 3: Problem in the text (Chapter 3) Sweet Dreams Corp. Balance Sheet As of Dec. 31 2017 Assets 2017 2016 Cash 431,000 339,000 Accounts Receivable 503.000 365,000 Inventories 289,000 300,000 Total Current Assets 1.223,000 7,004,000 Sweet...
please show how numbers are calculated. and all work
must be done in excel
CHAPTER 3: FINANCIAL STATEMENT ANALYSIS TOOLS NOTE: PLEASE USE WORKSHEET #3 IN THE ATTACHED EXCEL FILE TITLED "Homework for Chapter 3 Excel TO SOLVE THE FOLLOWING PROBLEM. Homework for Chapter 3: Problem in the text (Chapter 3) Sweet Dreams Corp. Balance Sheet As of Dec. 31 2017 Assets 2017 2016 Cash 431,000 339,000 Accounts Receivable 503.000 365,000 Inventories 289,000 300,000 Total Current Assets 1.223,000 7,004,000 Sweet...
Sales Revenues Cost of Goods Sold Gross Profit s 1,000 600 400 Depreciation Expense Other Operating...
 Sales Revenues Cost of Goods Sold Gross Profit s 1,000 600 400 Depreciation Expense Other Operating Expenses S 100 50 Total Operating Expenses Earnings Before Interest& Taxes (EBIT) Interest Expense Eamings Before Taxes Income Tax Expense Net Income 150 250 50 200 100 S 100 Beginning Owner's Equity Net Income Dividends Ending Owner's Equity s 2,950 100 50 S 3,000 Cash Receivables Inventory s 1,000 100 900 Current Assets Long-Term Assets Total Assets s 2,000 7,000 S 9,000 Current Liabilities...
Ratios 2016 2015 a. Gross profit margin (%) 39.4 39.1 b. Operating profit margin (%) 5.1...
 Ratios
2016
2015
a.
Gross profit margin (%)
39.4
39.1
b.
Operating profit margin (%)
5.1
7.5
c.
Net profit margin (%)
2.4
4.0
d.
Return on shareholders' equity (%)
14.1
25.2
e.
Return on assets (%)
3.1
5.2
f.
Times interest earned coverage
3.6
5.6
g.
Long-term debt-to-equity ratio
1.5
3.8
h.
Days of inventory
126.2
121.8
i.
Inventory turnover ratio
2.9
3.0
j.
Average collection
period
7.4
7.5
1-From 2015 to 2016, Macy’s, Inc., return on equity and...
Ratios
2016
2015
a.
Gross profit margin (%)
39.4
39.1
b.
Operating profit margin (%)
5.1
7.5
c.
Net profit margin (%)
2.4
4.0
d.
Return on shareholders' equity (%)
14.1
25.2
e.
Return on assets (%)
3.1
5.2
f.
Times interest earned coverage
3.6
5.6
g.
Long-term debt-to-equity ratio
1.5
3.8
h.
Days of inventory
126.2
121.8
i.
Inventory turnover ratio
2.9
3.0
j.
Average collection
period
7.4
7.5
1-From 2015 to 2016, Macy’s, Inc., return on equity and...
Do It! Review 9-3 |x Your answer is incorrect. Try again. The condensed financial statements of...
 Do It! Review 9-3 |x Your answer is incorrect. Try again. The condensed financial statements of Blossom Company for the years 2016 and 2017 are presented as follows. (Amounts in thousands.) BLOSSOM COMPANY Balance Sheets December 31 2017 2016 $360 570 450 Current assets Cash and cash equivalents Accounts receivable (net) Inventory Prepaid expenses Total current assets Investments Property, plant, and equipment (net) Intangibles and other assets 160 $330 640 520 120 1,610 180 420 530 1,540 180 380 510...
 I am attaching the pictures. the instructions is the first pic
and the answers go on the last page
The Income Statement and Balance Sheet for The Home Depot, Inc. can be found as separate worksheets on tabs (a) and (b), respectively. On worksheet O, prepare a ratio analysis for 2017 and 2016 that includes the following ratios: Current ratio Net income to average common stockholder's equity Inventory turnover Number of days' sales in accounts receivable (assume 365 days in...
I am attaching the pictures. the instructions is the first pic
and the answers go on the last page
The Income Statement and Balance Sheet for The Home Depot, Inc. can be found as separate worksheets on tabs (a) and (b), respectively. On worksheet O, prepare a ratio analysis for 2017 and 2016 that includes the following ratios: Current ratio Net income to average common stockholder's equity Inventory turnover Number of days' sales in accounts receivable (assume 365 days in...
 EXERCISE - CHAPTER 19. RATIOS: From the following Information, compute the ratios indicated and place the proper number in the blanks provided. ASSETS: Cash $10,000 Marketable Securities $15,000 Accounts Receivable, Net $20,000 Inventory $30,000 Prepaid Assets $ 5,000 Property, Plant & Equipment $100,000 Total Assets: $180,000 LIABILITIES & STOCKHOLDERS' EQUITY: Current Liabilities $20,000 Long-Term Liabilities $80,000 Stockholders' Equity $80,000 Total Liabilities & Stockholder's Equity: $180,000 Sales $200,000 Cost of Goods Sold $150.000 Gross Margin $ 50,000 Operating Expense $ 30,000...
 Calculate the ratios below given the financial data presented to your left. Answers Measures of Short-term Liquidity current assets / current liabilities quick assets / current liabilities net sales /accounts receivable 365 days/receivables turnover rate cost of goods sold/inventory current ratio quick ratico receivables turnover rate days to collect receivables inventory turnover rate Measures of Long-term Credit Risk total liabilities/total assets operating income /annual interest expense debt ratio Times Interest Earned Measures of Profitability net income / sales net income/total...
 Problem # 1 (50 points) Given the Income Statement and Balance Sheet Compute: Current Ratio Acid-Test Ratio Days in Receivable Days in Inventory Operating Profit Margin Total Asset Tumover Fixed-asset turnover Debt Ratio Times Interest Earned Return on Equity Income Statement Balance Sheet Assets Cash Accounts Receivable Inventory Prepaid Expenses Total Current Assets Gross Plant and Equipment Accumulated Depreciation Net Fixed Assets Total Assets $200,000 $60,000 $100,000 $20,000 $380,000 $802,000 -$132,000 $670,000 $1,050,000 Sales (all credit) Cost of Goods Sold...
 Can someone please explain how to
do this problem please! I would greatly appreciate it?
Problem 13-4A Calculation of financial statement ratios LO P3 Selected year-end financial statements of Cabot Corporation follow. (All sales were on credit; selected balance sheet amounts at December 31, 2016, were inventory, $49,900; total assets, $229,400; common stock, $84,000; and retained earnings, $42,205.) CABOT CORPORATION Income Statement For Year Ended December 31, 2017 Sales $ 452,600 Cost of goods sold 298,350 Gross profit 154,250 Operating...
Can someone please explain how to
do this problem please! I would greatly appreciate it?
Problem 13-4A Calculation of financial statement ratios LO P3 Selected year-end financial statements of Cabot Corporation follow. (All sales were on credit; selected balance sheet amounts at December 31, 2016, were inventory, $49,900; total assets, $229,400; common stock, $84,000; and retained earnings, $42,205.) CABOT CORPORATION Income Statement For Year Ended December 31, 2017 Sales $ 452,600 Cost of goods sold 298,350 Gross profit 154,250 Operating...
 please show how numbers are calculated. and all work
must be done in excel
CHAPTER 3: FINANCIAL STATEMENT ANALYSIS TOOLS NOTE: PLEASE USE WORKSHEET #3 IN THE ATTACHED EXCEL FILE TITLED "Homework for Chapter 3 Excel TO SOLVE THE FOLLOWING PROBLEM. Homework for Chapter 3: Problem in the text (Chapter 3) Sweet Dreams Corp. Balance Sheet As of Dec. 31 2017 Assets 2017 2016 Cash 431,000 339,000 Accounts Receivable 503.000 365,000 Inventories 289,000 300,000 Total Current Assets 1.223,000 7,004,000 Sweet...
please show how numbers are calculated. and all work
must be done in excel
CHAPTER 3: FINANCIAL STATEMENT ANALYSIS TOOLS NOTE: PLEASE USE WORKSHEET #3 IN THE ATTACHED EXCEL FILE TITLED "Homework for Chapter 3 Excel TO SOLVE THE FOLLOWING PROBLEM. Homework for Chapter 3: Problem in the text (Chapter 3) Sweet Dreams Corp. Balance Sheet As of Dec. 31 2017 Assets 2017 2016 Cash 431,000 339,000 Accounts Receivable 503.000 365,000 Inventories 289,000 300,000 Total Current Assets 1.223,000 7,004,000 Sweet...
 Sales Revenues Cost of Goods Sold Gross Profit s 1,000 600 400 Depreciation Expense Other Operating Expenses S 100 50 Total Operating Expenses Earnings Before Interest& Taxes (EBIT) Interest Expense Eamings Before Taxes Income Tax Expense Net Income 150 250 50 200 100 S 100 Beginning Owner's Equity Net Income Dividends Ending Owner's Equity s 2,950 100 50 S 3,000 Cash Receivables Inventory s 1,000 100 900 Current Assets Long-Term Assets Total Assets s 2,000 7,000 S 9,000 Current Liabilities...
 Ratios
2016
2015
a.
Gross profit margin (%)
39.4
39.1
b.
Operating profit margin (%)
5.1
7.5
c.
Net profit margin (%)
2.4
4.0
d.
Return on shareholders' equity (%)
14.1
25.2
e.
Return on assets (%)
3.1
5.2
f.
Times interest earned coverage
3.6
5.6
g.
Long-term debt-to-equity ratio
1.5
3.8
h.
Days of inventory
126.2
121.8
i.
Inventory turnover ratio
2.9
3.0
j.
Average collection
period
7.4
7.5
1-From 2015 to 2016, Macy’s, Inc., return on equity and...
Ratios
2016
2015
a.
Gross profit margin (%)
39.4
39.1
b.
Operating profit margin (%)
5.1
7.5
c.
Net profit margin (%)
2.4
4.0
d.
Return on shareholders' equity (%)
14.1
25.2
e.
Return on assets (%)
3.1
5.2
f.
Times interest earned coverage
3.6
5.6
g.
Long-term debt-to-equity ratio
1.5
3.8
h.
Days of inventory
126.2
121.8
i.
Inventory turnover ratio
2.9
3.0
j.
Average collection
period
7.4
7.5
1-From 2015 to 2016, Macy’s, Inc., return on equity and...
 Do It! Review 9-3 |x Your answer is incorrect. Try again. The condensed financial statements of Blossom Company for the years 2016 and 2017 are presented as follows. (Amounts in thousands.) BLOSSOM COMPANY Balance Sheets December 31 2017 2016 $360 570 450 Current assets Cash and cash equivalents Accounts receivable (net) Inventory Prepaid expenses Total current assets Investments Property, plant, and equipment (net) Intangibles and other assets 160 $330 640 520 120 1,610 180 420 530 1,540 180 380 510...
Most questions answered within 3 hours.
-
Explain why case-mix analysis should be performed by
health care facilities. List other types of analysis...
asked 25 minutes ago -
1.
Today Tomorrow
Price of Coke 1.90 2.10
Quantity of Pepsi 297 303
a. Write down...
asked 1 hour ago -
Fluorine-20 has a half-life of 11.0 s. If a sample initially
contains 36.0 μg of this...
asked 2 hours ago -
How many fissions take place per second in a 190-MW reactor?
Assume 200 MeV is released...
asked 3 hours ago -
IQ scores are normally distributed with a mean of 100 and a
standard deviation of 15....
asked 3 hours ago -
You are to assess the biomechanics of a male’s arm using his
bicep to hold a...
asked 5 hours ago -
What is the maximum number of grams of N-acetyl-p-toluidine can
be prepared from 70. milliliters of...
asked 6 hours ago -
A researcher is using a two-tailed hypothesis test with α =
.05 to evaluate the effect...
asked 8 hours ago -
Two long, straight wires are parallel and 8.5 cm apart. The top
wire carries a current...
asked 9 hours ago -
Three arguments used to promote trade barriers are the national
security argument, the infant-industry argument, and...
asked 10 hours ago -
Question 3:
Percentage of Completion
Method (12 marks) On January 1, 2017, Eagle Construction Ltd.
started...
asked 10 hours ago -
A company purchased a tract of land for its natural resources at
a cost of $2,042,900....
asked 9 hours ago