
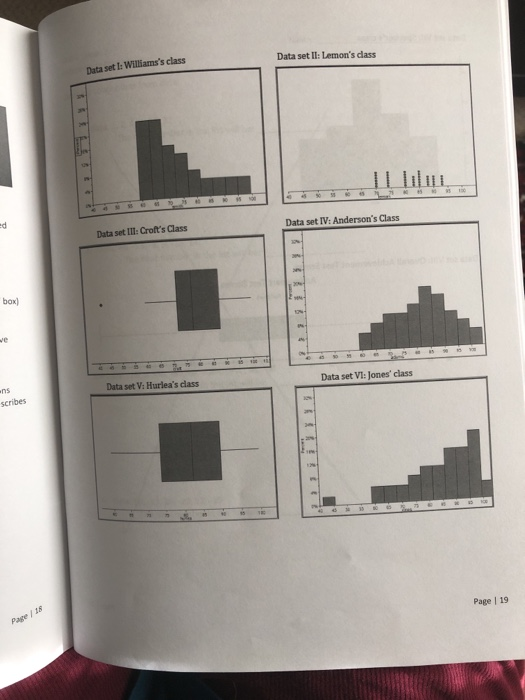
Data set I: Williams's class Data set II: Lemon's class o Data set II1: Croft's Class Data set IV: Anderson's Class 3% box) ve ns Data set V: Hurlea's class Data set VI: Jones' class scribes 2m- 12%- an Page / 18 Page | 19
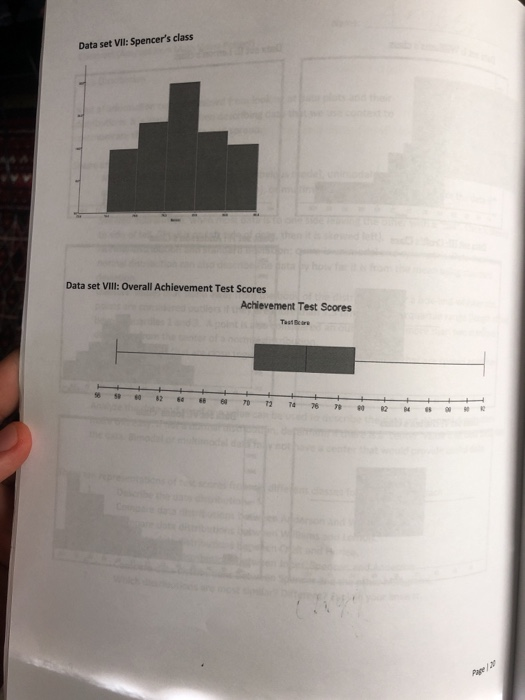
Data set VIlI: Spencer's class Data set VIll: Overall Achievement Test Scores Achievement Test Scores Tast ars 82 70 72 74 2 Pare/2
Homework Answers
Add Answer to:
Unit 6 Lesson 3 Classwork (Adapted from Math Vision Project) Data Distribution A lot of information...
Unit 6 Lesson 3 Classwork (Adapted from Math Vision Project) Data Distribution A lot of information...
 Unit 6 Lesson 3 Classwork (Adapted from Math Vision Project) Data Distribution A lot of information can be obtained from looking at data plots and their distributions. It is important when describing data that we use context to communicate the shape, center, and spread. Shape and spread: Modes: uniform (evenly spread- no obvious mode), unimodal (one main peak), bimodal (two main peaks), or multimodal (multiple locations where the data is relatively higher than others). Skewed distribution: when most data is...
The shape of a distribution is a rough guide to whether the mean and standard deviation...
 The shape of a distribution is a rough guide to whether the mean and standard deviation are a helpful summary of center and variability. Review each of the distributions and determine whether the measures and s would be useful. (a) The figure shows percents of high school graduates in the United States taking the SAT Two peaks suggest that the data include two types of states. 2 20 40 60 80 100 Percent of high school graduates who took the...
PLEASE ANSWER CLEARLY The graph below shows the distribution of age by class type (on campus...
 PLEASE ANSWER CLEARLY
The graph below shows the distribution of age by class type (on campus or distance learning) for Math 2600 students during the Fall 2019 semester. The graph on the left corresponds to the ages for Math 2600 online students and the graph on the right corresponds to the Math 2600 students taking class on campus. Summary statistics for Age: Group by: OCDL OCDL Mean Std. dev.. Median Min • Max. Range - Q123 • IQR On Campus...
PLEASE ANSWER CLEARLY
The graph below shows the distribution of age by class type (on campus or distance learning) for Math 2600 students during the Fall 2019 semester. The graph on the left corresponds to the ages for Math 2600 online students and the graph on the right corresponds to the Math 2600 students taking class on campus. Summary statistics for Age: Group by: OCDL OCDL Mean Std. dev.. Median Min • Max. Range - Q123 • IQR On Campus...
STAT 151 displaying and describing distributions (LAB 1) The titanic disaster
5. Now study the distribution of the age of the Titanic passengers. (a) Obtain a relative frequency histogram of age. Use the default class bins provided by the software. Paste the histogram into your report. The format of your histogram should be the same as the format of the histogram in the Lab 1 Instructions (title and labels). (b) What is the shape of the histogram? Is it symmetric or skewed? Is it single-peaked or doublepeaked? Suggest an explanation for the pattern...
 Unit 6 Lesson 3 Classwork (Adapted from Math Vision Project) Data Distribution A lot of information can be obtained from looking at data plots and their distributions. It is important when describing data that we use context to communicate the shape, center, and spread. Shape and spread: Modes: uniform (evenly spread- no obvious mode), unimodal (one main peak), bimodal (two main peaks), or multimodal (multiple locations where the data is relatively higher than others). Skewed distribution: when most data is...
 The shape of a distribution is a rough guide to whether the mean and standard deviation are a helpful summary of center and variability. Review each of the distributions and determine whether the measures and s would be useful. (a) The figure shows percents of high school graduates in the United States taking the SAT Two peaks suggest that the data include two types of states. 2 20 40 60 80 100 Percent of high school graduates who took the...
 PLEASE ANSWER CLEARLY
The graph below shows the distribution of age by class type (on campus or distance learning) for Math 2600 students during the Fall 2019 semester. The graph on the left corresponds to the ages for Math 2600 online students and the graph on the right corresponds to the Math 2600 students taking class on campus. Summary statistics for Age: Group by: OCDL OCDL Mean Std. dev.. Median Min • Max. Range - Q123 • IQR On Campus...
PLEASE ANSWER CLEARLY
The graph below shows the distribution of age by class type (on campus or distance learning) for Math 2600 students during the Fall 2019 semester. The graph on the left corresponds to the ages for Math 2600 online students and the graph on the right corresponds to the Math 2600 students taking class on campus. Summary statistics for Age: Group by: OCDL OCDL Mean Std. dev.. Median Min • Max. Range - Q123 • IQR On Campus...
Most questions answered within 3 hours.
-
Using MARS simulator, write MIPS programs according to
the following scenarios: Receive a positive integer number...
asked 41 minutes ago -
An object in front of a concave mirror has a real image that is
11.5 cm...
asked 55 minutes ago -
Consider the reaction, C3 H8 + O2 --> CO2 + H2O. How many
moles of O2...
asked 2 hours ago -
You and your opponent both roll a fair die. If you both roll the
same number,...
asked 2 hours ago -
In a study of the accuracy of fast food drive-through orders,
Restaurant A had 257 accurate...
asked 2 hours ago -
Identify and describe in detail the four categories of
institutions that could be included in a...
asked 3 hours ago -
In python
class Customer:
def __init__(self, customer_id, last_name, first_name, phone_number, address):
self._customer_id = int(customer_id)
self._last_name =...
asked 3 hours ago -
What is an example of a limitation in implementing a new
ERP system and how it...
asked 3 hours ago -
In a section of 9.7cm of an artery with a radius of 2.6mm there
is a...
asked 3 hours ago -
the two carboxylic acid groups of aspartic acid have different
acidities with pKa values of 2.1...
asked 3 hours ago -
Would CuCO3 aqueous salt combined with calcium chloride
form a solid precipitate? If so, what would...
asked 3 hours ago -
How do ECM Solutions assist in embedding a culture of continuous
improvement in an organization? (Project...
asked 3 hours ago