The student-center cafeteria at Big State University is trying to improve its service duri...
The student-center cafeteria at Big State University is trying to improve its service during the lunch rush from 11:30 A.M. to 1:00 P.M. Customers arrive together in groups of size 1, 2, 3, and 4, with respective probabilities 0.5, 0.3, 0.1, and 0.1. Interarrival times between groups are exponentially distributed with mean 30 seconds. Initially, the system is empty and idle, and is to run for the 90-minute period. Each arriving customer, whether alone or part of a group, takes one of three routes through the cafeteria (groups in general split up after they arrive):
• Hot-food service, then drinks, then cashier
• Specialty-sandwich bar, then drinks, then cashier
• Drinks (only), then cashier
The probabilities of these routes are respectively 0.80, 0.15, and 0.05; see Fig 2.68. At the hot-food counter and the specialty-sandwich bar, customers are served one at a time (although there might actually be one or two workers present, as discussed below). The drinks stand is self-service, and assume that nobody ever has to queue up here; this is equivalent to thinking of the drinks stand as having infinitely many servers. There are either two or three cashiers (see below), each having his own queue, and there is no jockeying; customers arriving to the cashiers simply choose the shortest queue. All queues in the model are FIFO.
In Fig. 2.68, ST stands for service time at a station, and ACT stands for the accumulated (future) cashier time due to having visited a station; the notation ~U(a, b) means that the corresponding quantity is distributed uniformly between a and b seconds. For example, a route 1 customer goes first to the hot-food station, joins the queue there if necessary, receives service there that is uniformly distributed between 50 and 120 seconds, “stores away” part of a (future) cashier time that is uniformly distributed between 20 and 40 seconds, then spends an amount of time uniformly distributed between 5 seconds and 20 seconds getting a drink, and accumulates an additional amount of (future) cashier time distributed uniformly between 5 seconds and 10 seconds. Thus, his service requirement at a cashier will be the sum of the U(20, 40) and U(5, 10) random variates he “picked up” at the hot-food and drinks stations.
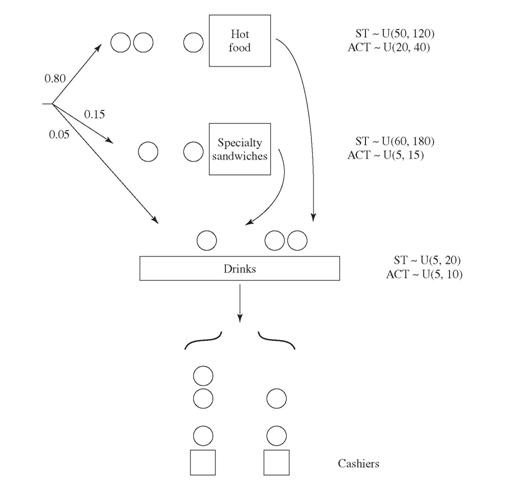
FIGURE 2.68 The BSU cafeteria.
Report the following measures of system performance:
• The average and maximum delays in queue for hot food, specialty sandwiches, and cashiers (regardless of which cashier)
• The time-average and maximum number in queue for hot food and specialty sandwiches (separately), and the time-average and maximum total number in all cashier queues
• The average and maximum total delay in all the queues for each of the three types of customers (separately)
• The overall average total delay for all customers, found by weighting their individual average total delays by their respective probabilities of occurrence
• The time-average and maximum total number of customers in the entire system (for reporting to the fire marshall)
There are several questions about the system’s operation. For security reasons, there must be at least 2 cashiers, and the maximum number of cashiers is 3. Also, there must be at least one person working at each of the hot-food and specialty-sandwich stations.
Thus, the minimum number of employees is 4; run this as the “base-case” model. Then, consider adding employees, in several ways:
(a) Five employees, with the additional person used in one of the following ways:
(i) As a third cashier
(ii) To help at the hot-food station. In this case, customers are still served one at a time, but their service time is cut in half, being distributed uniformly between 25 seconds and 60 seconds.
(iii) To help at the specialty-sandwich bar, meaning that service is still one at a time, but distributed uniformly between 30 seconds and 90 seconds
(b) Six employees, in one of the following configurations:
(i) Two cashiers, and two each at the hot-food and specialty-sandwich stations
(ii) Three cashiers, two at hot food, and one at specialty sandwiches
(iii) Three cashiers, one at hot food, and two at specialty sandwiches
(c) Seven employees, with three cashiers, and two each at the hot-food and specialty-sandwich stations
Run the simulation for all seven expansion possibilities, and make a recommendation as to the best employee deployment at each level of the number of employees. In all cases, use stream 1 for the interarrival times between groups, stream 2 for the group sizes, stream 3 for an individual’s route choice, streams 4, 5, and 6 for the STs at the hot-food, specialty-sandwich, and drinks stations, respectively, and streams 7, 8, and 9 for the ACTs at these respective stations.
Step-by-Step Solution
Request Solution!
We need at least 10 more requests to produce the solution.
0 / 10 have requested this problem solution
The more requests, the faster the answer.
Most questions answered within 3 hours.
-
Calculating the space time for parallel reactions. m-Xylene is reacted over a ZSM-5 zeolit...
-
Determine Vo and ID for the networks of Fig. 2.160.FIG. 2.160
-
The truck travels along a circular road that has a radius of 50 m at a speed of 4 m/s. F...
-
A state legislature enacted a statute that required any motorcycle operator or passenger...
-
A 1024 × 1024 8-bit image with 5.3 bits/pixel entropy [computed from its histogram using E...
-
In Problem 3.3, we estimated the equationwhere we now report standard errors along with th...
-
In each of the following cases, deduce the nature of the light that is consistent with the...
-
Solve Example 20.5 such that the x, y, z axes move with curvilinear translation, Ω = 0 in...
-
In Fig. 6.43, if i = cos 4t and v = sin 4t, the element is:(a)a resistor(b) a capacitor(c)...
-
Sketch vo for each network of Fig. 2.181 for the input shown.FIG. 2.181
-
(Supplement B) Computing and Reporting Cash Flow Effectsof Sale of Plant and EquipmentDuri...
-
A 350-mL spherical flask contains 0.075 mol of an ideal gas at a temperature of 293 K. Wha...