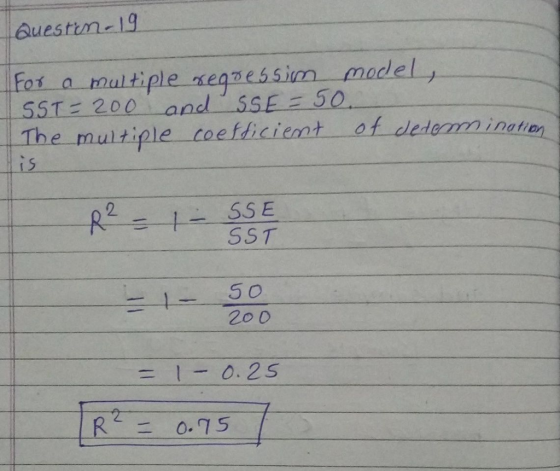
Question 19 For a multiple regression model, SST= 200 and SSE = 50
Question 19
For a multiple regression model, SST= 200 and SSE = 50. The multiple coefficient of determination is
0.25
4.00
250
0.75
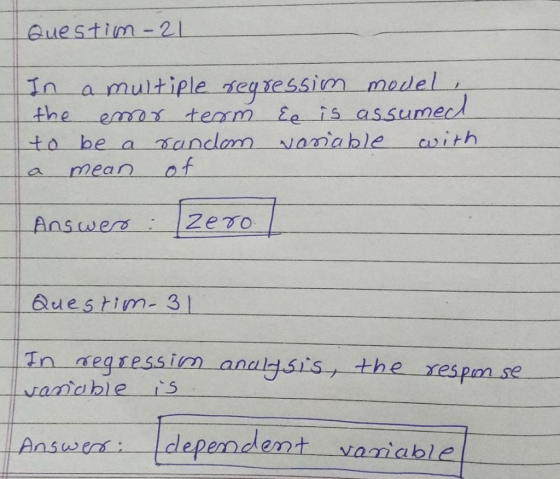
Question 21
In a multiple regression model, the error term εe is assumed to be a random variable with a mean of
zero
-1
1
any value
Question 31
In regression analysis, the response variable is the
independent variable
dependent variable
slope of the regression function
intercept
Homework Answers
In a multiple regression analysis involving 8 independent variables and 165 observations, SST = 650 and...
In a multiple regression analysis involving 8 independent variables and 165 observations, SST = 650 and SSE = 247. The coefficient of determination is equal to what value? (Report your answer as a proportion to 2 decimal places, using conventional rounding rules)
The ANOVA summary table to the right is for a multiple regression model with nine independent var...
 The ANOVA summary table to the right is for a multiple regression model with nine independent variables. Complete parts (a) through (e) Degrees of Source Freedom Squares Sum of Regression Error Total 260 180 440 19 28 5909 (Round to four decimal places as needed.) Interpret the meaning of the coefficient of multiple determination The coefficient of multiple determination indicates that 59.09% of the variation in the dependent variable can be explained by the variation in the independent variables e....
1. In regression analysis, the Sum of Squares Total (SST) is a. The total variation of...
1. In regression analysis, the Sum of Squares Total (SST) is a. The total variation of the dependent variable b. The total variation of the independent variable c. The variation of the dependent variable that is explained by the regression line d. The variation of the dependent variable that is unexplained by the regression line Question 2 In regression analysis, the Sum of Squares Regression (SSR) is A. The total variation of the dependent variable B. The total variation of the independent variable...
e Pas 2. If SSE is near zero in a regression, conclusion will be that the...
 e Pas 2. If SSE is near zero in a regression, conclusion will be that the proposed model probably has a. too poor a fit to be useful b. near perfect fit c. a very strong positive linear relation d. a very strong negative linear relation 3. A residual/error shows the difference between Yactual and Yestimated on a standard scale. True False 4. In a simple regression, the F statistic is calculated by taking the ratio of MSR to the...
In simple regression analysis the quantity that gives the amount by which...
17. In simple regression analysis the quantity that gives the amount by which Y (dependent variable) changes for a unit change in X (independent variable) is called theA. Coefficient of determinationB. Slope of the regression lineC. Y intercept of the regression lineD. Correlation coefficientE. Standard error18. A simple regression analysis with 20 observations would yield ________ degrees of freedom error and _________ degrees of freedom total.A. 1, 20B. 18,19C. 19, 20D. 1, 19E. 18, 2019. The correlation coefficient may assume...
Question 6 (10 marks) Finally, the researcher considers using regression analysis to establish a linear relationship...
Question 6 (10 marks) Finally, the researcher considers using regression analysis to establish a linear relationship between the two variables – hours worked per week and yearly income. a) What is the dependent variable and independent variable for this analysis? Why? (2 marks) b) Use an appropriate plot to investigate the relationship between the two variables. Display the plot. On the same plot, fit a linear trend line including the equation and the coefficient of determination R2 . (2 marks)...
For the following question (#19 and #20), please use the following multiple regression output. The dependent...
 For the following question (#19 and #20), please use the following multiple regression output. The dependent variable is Home Price: ($) the independent variables are Number of Bedrooms, Size (square footage), and Pool (0 = no pool, 1 = pool). 19: Which statement is correct? SUMMARY OUTPUT A: The R square of 571 is the best goodness of fit statistic to use for multiple regression analyses. B: The Number of Bedrooms is not a significant predictor variable. Regression Statistics Multiple...
Consider a multiple regression model of the dependent variable y on independent variables x1, X2, X3, and x4: Using data with n 60 observations for each of the variables, a student obtains the follow...
 Consider a multiple regression model of the dependent variable y on independent variables x1, X2, X3, and x4: Using data with n 60 observations for each of the variables, a student obtains the following estimated regression equation for the model given: y0.35 0.58x1 + 0.45x2-0.25x3 - 0.10x4 He would like to conduct significance tests for a multiple regression relationship. He uses the F test to determine whether a significant relationship exists between the dependent variable and He uses the t...
2. Multiple coefficient of determination Aa Aa Macroeconomics is the study of the economy as a...
 2. Multiple coefficient of determination Aa Aa Macroeconomics is the study of the economy as a whole. A macroeconomic variable is one that measures a characteristic of the whole economy or one of its large-scale sectors. In forecasting the sales of a product, market researchers frequently use macroeconomic variables in addition to marketing mix variables (marketing mix variables include product, price, place [or distribution], and promotion) A market researcher is analyzing an existing multiple regression model that predicts sales for...
 The ANOVA summary table to the right is for a multiple regression model with nine independent variables. Complete parts (a) through (e) Degrees of Source Freedom Squares Sum of Regression Error Total 260 180 440 19 28 5909 (Round to four decimal places as needed.) Interpret the meaning of the coefficient of multiple determination The coefficient of multiple determination indicates that 59.09% of the variation in the dependent variable can be explained by the variation in the independent variables e....
 e Pas 2. If SSE is near zero in a regression, conclusion will be that the proposed model probably has a. too poor a fit to be useful b. near perfect fit c. a very strong positive linear relation d. a very strong negative linear relation 3. A residual/error shows the difference between Yactual and Yestimated on a standard scale. True False 4. In a simple regression, the F statistic is calculated by taking the ratio of MSR to the...
 For the following question (#19 and #20), please use the following multiple regression output. The dependent variable is Home Price: ($) the independent variables are Number of Bedrooms, Size (square footage), and Pool (0 = no pool, 1 = pool). 19: Which statement is correct? SUMMARY OUTPUT A: The R square of 571 is the best goodness of fit statistic to use for multiple regression analyses. B: The Number of Bedrooms is not a significant predictor variable. Regression Statistics Multiple...
 Consider a multiple regression model of the dependent variable y on independent variables x1, X2, X3, and x4: Using data with n 60 observations for each of the variables, a student obtains the following estimated regression equation for the model given: y0.35 0.58x1 + 0.45x2-0.25x3 - 0.10x4 He would like to conduct significance tests for a multiple regression relationship. He uses the F test to determine whether a significant relationship exists between the dependent variable and He uses the t...
 2. Multiple coefficient of determination Aa Aa Macroeconomics is the study of the economy as a whole. A macroeconomic variable is one that measures a characteristic of the whole economy or one of its large-scale sectors. In forecasting the sales of a product, market researchers frequently use macroeconomic variables in addition to marketing mix variables (marketing mix variables include product, price, place [or distribution], and promotion) A market researcher is analyzing an existing multiple regression model that predicts sales for...
Most questions answered within 3 hours.
-
Please answer ASAP 2) Choose a point at random from the unit
square [0, 1] ×...
asked 8 minutes ago -
Draw the Lewis structures and determine which of these
molecules has a central atom that unavoidably...
asked 9 minutes ago -
Do we typically carry antibodies against the RH antigen in our
blood plasma?
asked 11 minutes ago -
What are the differences between an antibiotic, a semisynthetic,
and a synthetic as types of antimicrobials?
asked 7 minutes ago -
One mole of oxygen gas is at a pressure of 5.90 atm and a
temperature of...
asked 15 minutes ago -
The primary side of a transformer has 935 turns and is connected
to 118 Volts A/C....
asked 13 minutes ago -
This must be done in Java and it must contain a public static
void (string []args)...
asked 16 minutes ago -
An economy has a Cobb–Douglas production function:
Y=Kα(LE)1−αY=Kα(LE)1−α
The economy has a capital share of 0.30,...
asked 31 minutes ago -
60.0 mL of a silver chlorate solution with a concentration of
0.654 M is mixed with...
asked 36 minutes ago -
Asked if he has any regrets about the way he's handled the
coronavirus crisis so far,...
asked 48 minutes ago -
True or False?
Considering a door as a rigid body. Its angular motion happens
in a...
asked 51 minutes ago -
In
IUPAC naming, do we concider the prefix in alphabatizing?
In other words do we look...
asked 56 minutes ago