Answer all questions please!!! The mean gas mileage for a hybrid car is 56 miles per gallon. Supp...
answer all questions please!!!
The mean gas mileage for a hybrid car is
56
miles per gallon. Suppose that the gasoline mileage is approximately normally distributed with a standard deviation of
3.2
miles per gallon. (a) What proportion of hybrids gets over
62
miles per gallon? (b) What proportion of hybrids gets
52
miles per gallon or less?
left parenthesis c right parenthesis What(c) What
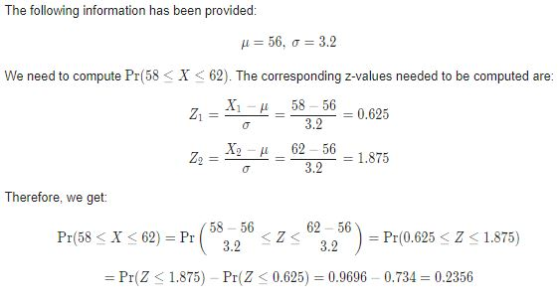
proportion of hybrids gets between
58
and
62
miles per gallon? (d) What is the probability that a randomly selected hybrid gets less than
45
miles per gallon?
LOADING...
Click the icon to view a table of areas under the normal curve.
(a) The proportion of hybrids that gets over
62
miles per gallon is
nothing.
(Round to four decimal places as needed.)
Homework Answers
Answer a) The proportion of hybrids gets over 62 is 0.0304

Answer b) The proportion of hybrids gets 52 miles per gallon or less is 0.1056

Answer c) The proportion of hybrids gets between 58 and 62 miles per gallon is 0.2356
Answer d) The probability that a randomly selected hybrid gets less than 45 miles per gallon is 0.0003

Add Answer to:
Answer all questions please!!! The mean gas mileage for a hybrid car is 56 miles per gallon. Supp...
The mean gas mileage for a hybrid car is 57 miles per gallon. Suppose that the...
 The mean gas mileage for a hybrid car is 57 miles per gallon. Suppose that the gasoline mileage is approximately normally distributed with a standard deviation of 35 miles per on What proportion of lyrics pots ver miles per gallon? (b) What proportion of hybrids gets 53 miles per gallon or less (c) What proportion of hybrids gets between 57 and 61 miles per gallon? What is the probably that a randomly selected Hybrid gets less than 45 miles per...
The average gas mileage of a certain model car is 29 miles per gallon. If the...
The average gas mileage of a certain model car is 29 miles per gallon. If the gas mileages are normally distributed with a standard deviation of 2.4, find the probability that a car has a gas mileage of between 30 and 35 miles per gallon.
Gas mileage (measured in miles per gallon) of a new car model is normally distributed with...
Gas mileage (measured in miles per gallon) of a new car model is normally distributed with a mean of 95 miles per gallon and a standard deviation of 17 miles per gallon. What is the median of this distribution? A.95 B.75 C.105 D.85 E.65
A certain car model has a mean gas mileage of 34 miles per gallon with a...
A certain car model has a mean gas mileage of 34 miles per gallon with a standard deviation of 4 mpg. A pizza delivery conpany buys 54 of these cars. What is the probability that the average mileage of the fleet is between 33.3 and 34.3 mpg?
a certain car model has a mean gas mileage of 34 Miles per gallon (mpg) with...
 a certain car model has a mean gas mileage of 34 Miles per
gallon (mpg) with a population standard deviation for. A pizza
delivery company buys a sample of 54 of these cars. What is the
probability that the average mileage of the fleet is greater than
33.7 MPG?
Question 14 (3 points) A certain car model has a mean gas mileage of 34 miles per gallon (mpg) with a population standard deviation 4. A pizza delivery company buys a...
a certain car model has a mean gas mileage of 34 Miles per
gallon (mpg) with a population standard deviation for. A pizza
delivery company buys a sample of 54 of these cars. What is the
probability that the average mileage of the fleet is greater than
33.7 MPG?
Question 14 (3 points) A certain car model has a mean gas mileage of 34 miles per gallon (mpg) with a population standard deviation 4. A pizza delivery company buys a...
A certain model of automobile has its gas mileage (in miles per gallon, or mpg) normally...
A certain model of automobile has its gas mileage (in miles per gallon, or mpg) normally distributed, with a mean of 26 mpg and a standard deviation of 4 mpg. Find the probability that a car selected at random has the following gas mileages. (Round your answers to four decimal places.) (a) less than 20 mpg (b) greater than 28 mpg (c) between 24 and 28 mpg
The corporate average fuel economy (CAFE) standard for mileage is currently 26.5 miles per gallon of gasoline (the defen...
The corporate average fuel economy (CAFE) standard for mileage is currently 26.5 miles per gallon of gasoline (the defender) for passenger cars. To conserve fuel and reduce air pollution, suppose the u.s Congress sets the CAFE standard at 35 miles per gallon(the challenger) in 2010. An auto will emit on average 0.8 pounds of carbon dioxide(c02) per mile driven at 26.5 miles per gallon, and will emit 0.65 pounds of CO2 per mile driven at 35 miles per gallon. A....
The combined gas mileage of mid-size cars varies with mean 25 miles per gallon (mpg) and...
The combined gas mileage of mid-size cars varies with mean 25 miles per gallon (mpg) and a standard deviation of about 5.3 mpg. A particular rental car agency typically has 88 midsize cars in its lot. Assume the distribution of combined gas mileage of mid-size cars is Normal. Find the probability that the combined gas mileage for a randomly selected car in the lot is higher than 25 mpg. Find the probability that the mean combined gas mileage for all...
The gas mileages (in miles per gallon) of 28 randomly selected sports cars are listed in...
 The gas mileages (in miles per gallon) of 28 randomly selected sports cars are listed in the accompanying table. Assume the mileages are not normally distributed. Use the standard normal distribution or the t-distribution to construct a 99% confidence interval for the population mean. Justify your decision. If neither distribution can be used, explain why. Interpret the results. 囲Click the icon to view the sports car gas mileages. Let o be the population standard deviation and let n be the...
A new motorcycle is being developed to meet new gas mileage standards recently passed by the...
A new motorcycle is being developed to meet new gas mileage standards recently passed by the federal government. An engineer tested three model designs by randomly assigning the motorcycles in a blind study (the riders recorded the mileage but did not know the design of the motorcycle, only its code). The data in miles per gallon (MPG) for the three designs is listed below: X-1 B-1 Z-1 45 55 54 62 55 52 50 54 41 65 44 40 62...
 The mean gas mileage for a hybrid car is 57 miles per gallon. Suppose that the gasoline mileage is approximately normally distributed with a standard deviation of 35 miles per on What proportion of lyrics pots ver miles per gallon? (b) What proportion of hybrids gets 53 miles per gallon or less (c) What proportion of hybrids gets between 57 and 61 miles per gallon? What is the probably that a randomly selected Hybrid gets less than 45 miles per...
 a certain car model has a mean gas mileage of 34 Miles per
gallon (mpg) with a population standard deviation for. A pizza
delivery company buys a sample of 54 of these cars. What is the
probability that the average mileage of the fleet is greater than
33.7 MPG?
Question 14 (3 points) A certain car model has a mean gas mileage of 34 miles per gallon (mpg) with a population standard deviation 4. A pizza delivery company buys a...
a certain car model has a mean gas mileage of 34 Miles per
gallon (mpg) with a population standard deviation for. A pizza
delivery company buys a sample of 54 of these cars. What is the
probability that the average mileage of the fleet is greater than
33.7 MPG?
Question 14 (3 points) A certain car model has a mean gas mileage of 34 miles per gallon (mpg) with a population standard deviation 4. A pizza delivery company buys a...
 The gas mileages (in miles per gallon) of 28 randomly selected sports cars are listed in the accompanying table. Assume the mileages are not normally distributed. Use the standard normal distribution or the t-distribution to construct a 99% confidence interval for the population mean. Justify your decision. If neither distribution can be used, explain why. Interpret the results. 囲Click the icon to view the sports car gas mileages. Let o be the population standard deviation and let n be the...
Most questions answered within 3 hours.
-
You are working as an intern at a new company. Your boss, Paul,
was recently hired...
asked 25 minutes ago -
12.59 Place the following solutions in order of
increasing [H3O+]. Please explain your
reasoning.
0.10 M...
asked 28 minutes ago -
Coaching:
Most Salespeople are very comfortable with one on one
interactions with clients. But put some...
asked 39 minutes ago -
Marst Corporation's budgeted production in units and budgeted
raw materials purchases over the next three months...
asked 42 minutes ago -
Chemical equations for forming oxalate,
bioxalate, and redox with CO(NO3)2
asked 43 minutes ago -
Which one makes a good buffer with a pH of 5? a) H2C2)4 b)
H3AsO4 c)...
asked 46 minutes ago -
Transposable elements are found in the genomes of nearly every
species. What sequence features can be...
asked 1 hour ago -
the typical firm in the United States economy
(x) has some degree of market power.
(y)...
asked 1 hour ago -
Carragher &Company has a new management team that has
developed an operating plan to improve upon...
asked 1 hour ago -
Please explain a few critical of what is culture, and social
behavior based on the textbook...
asked 1 hour ago -
Long paths we show that for every n ≥ 3 if deg(v) ≥ n/2 for
every...
asked 1 hour ago -
I need a python code that would solve this. One of the jobs that
roberts has...
asked 1 hour ago